The information on this page refers to License Statistics v5.11, which added the ability to select a Time Interval when filtering results. If you are running a previous version of License Statistics, please refer to documentation prior to v5.11. |
From the License Servers page, the Uptime tab shows a chart of license server status for the currently selected license server during any period the server status was monitored.
To select a different license server for which to view the status, use the License Server pick list in the Select License Server section at the top of the page.
You can add this report to the License Statistics Dashboard. Learn more about customizing the Dashboard.
License Server Uptime chart
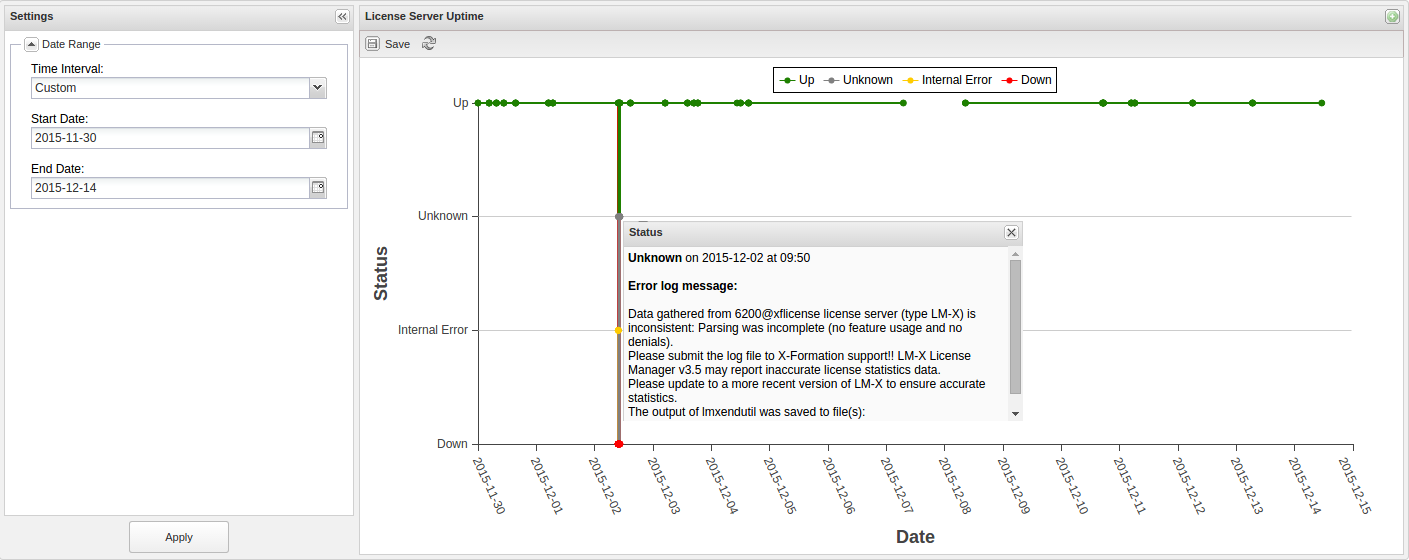
The License Server Uptime chart shows statistics about the license server status. (Note that the chart displays data for realtime servers only.)
The legend at the top of the chart defines the colors of the lines connecting data points in the chart, helping you quickly differentiate between various license server statuses. You can also use the legend to filter the results displayed by the chart. To see the results for a given license server status, click on the status for which you want to view the data.
Empty spaces or "gaps" in the chart indicate periods when License Statistics was not running and data was not being gathered.
Values displayed as dots on the chart indicate that one of the following has occurred:
- the status of the license server has changed
- an error message about the server status has been recorded in the error log
- License Statistics has been stopped
For the License Server Uptime chart, tooltips show the precise information of the time of one of the above events and optionally (if there is any), an error log message. You can see the tooltip content by hovering your mouse over the dots of the chart.
Saving and reloading data
If desired, you can save the License Server Uptime chart using Save button at the top left of the chart. You can also reload the data by clicking the Refresh icon.
Filtering results
You can filter license server status results by a specified date and time or you can choose the time period for which you want to view the license server status from the Settings panel, as described below.
Showing license server uptime for a particular time period
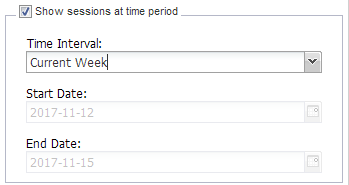
To specify a time period for which to view license server uptime, check the “Show sessions at time period” box in the Settings panel. Time intervals include:
- Current or Last Year
- Current or Last Quarter
- Current or Last Month
- Current or Last Week
- Today
- Yesterday
- Custom (which lets you enter a specific start and end date)
For example, you can limit the license server status report to the current week by selecting Current Week from the Time Interval drop-down list, as shown below.