The information on this page refers to License Statistics v6.14 and newer, which reorganized reports. If you are using a version previous to v6.14, see Removed Features for documentation relevant to versions prior to v6.14. For a limited time, a legacy menu structure is available at the bottom of the License Statistics menu, which lets you access the reports available prior to v6.14. |
The Sessions page under the Features: Realtime section in the left navigation pane shows currently open sessions and realtime usage statistics for the currently selected license/server feature or all license servers.
Use the License Server and Feature pick lists in the General Information area at the top of the report to select specific license servers and features for which to view current usage. You may also choose to view all license servers, or all features for a selected license server by selecting "All" from the pick lists. (When "All" is selected from the License Servers pick list, feature selection is unavailable.)
You can add the Realtime Sessions report's chart and grid to the License Statistics Dashboard using the pin at the top right of the pane. Learn more about customizing the Dashboard.
Realtime License Usage graph
The top section of the Realtime Sessions report contains a Realtime License Usage graph that gives you a visual picture of the number of licenses currently in use, and by which users, giving you instant understanding of highest license usage per user.
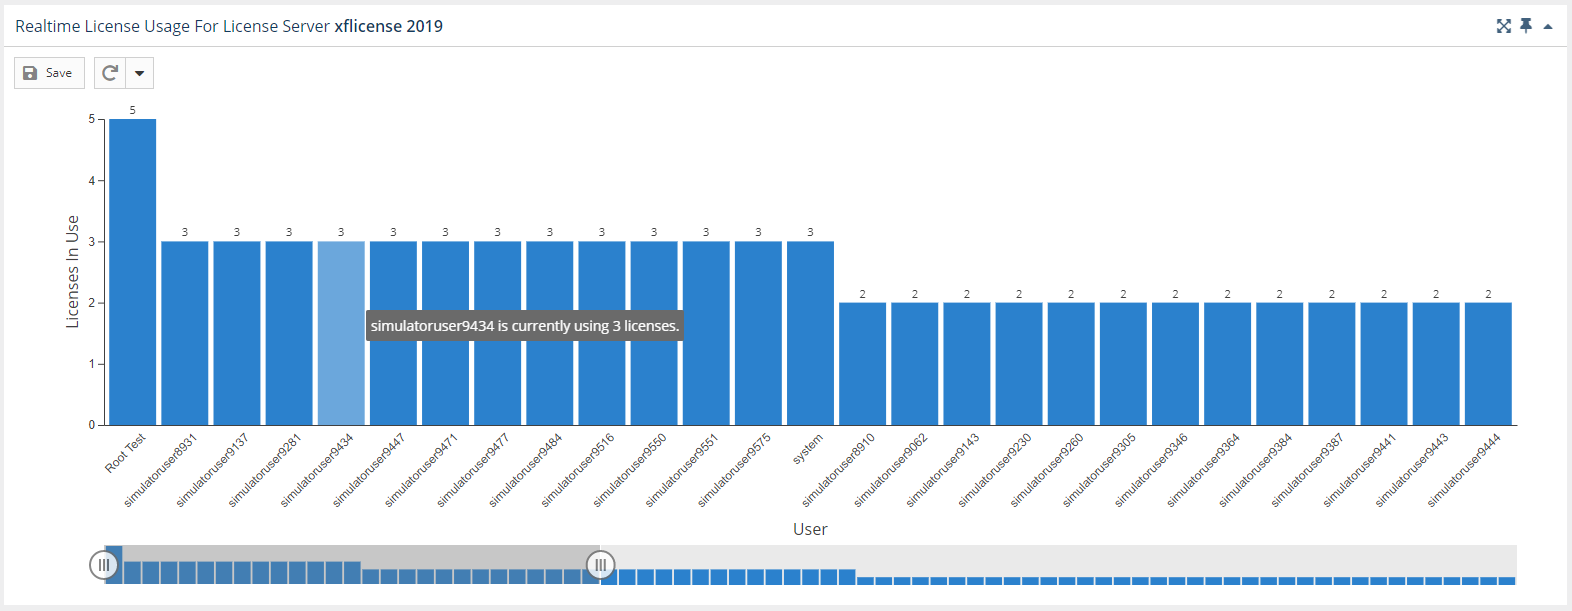
The slider at the bottom of the graph lets you restrict the results to the users you want to focus on (for example, you might use the slider to view only those users with more than 1 license in use).
If you select a license server/feature for which there is no realtime data, a popup with a link to view the history data for that license server/feature will appear in the upper right corner of the window.
See Feature usage graphs for additional information about feature use graphs.
Realtime Sessions grid
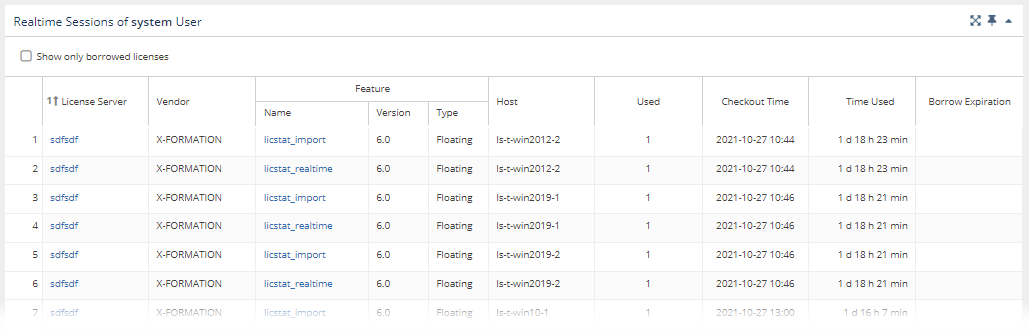
The lower section of the Sessions report contains a Realtime Sessions grid. This grid shows current usage of all licenses for the selected feature.
The Current Feature Usage grid includes the user and host (as well as host IP and host quantity, hidden by default) on which the selected feature is checked out, how many licenses that user has checked out, the checkout time(s) and how much time has elapsed since checkout, and for any borrowed licenses, when the borrow time expires.
Using this grid, you can see information such as:
- Usage by a specified time range
- Usage occurring for individual users on multiple hosts
- Borrowed license usage
These uses are described below.
Current usage by time range
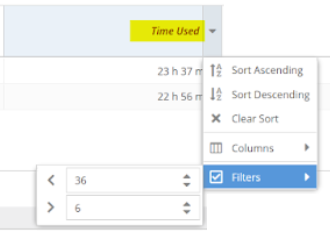
To see current usage by time range in the Realtime Sessions grid, make sure the "Time Used" column is visible, and filter by the desired time range. For example, you can filter by greater than 6 hours and less than 36 hours to see all results that are within this time range, as illustrated below.
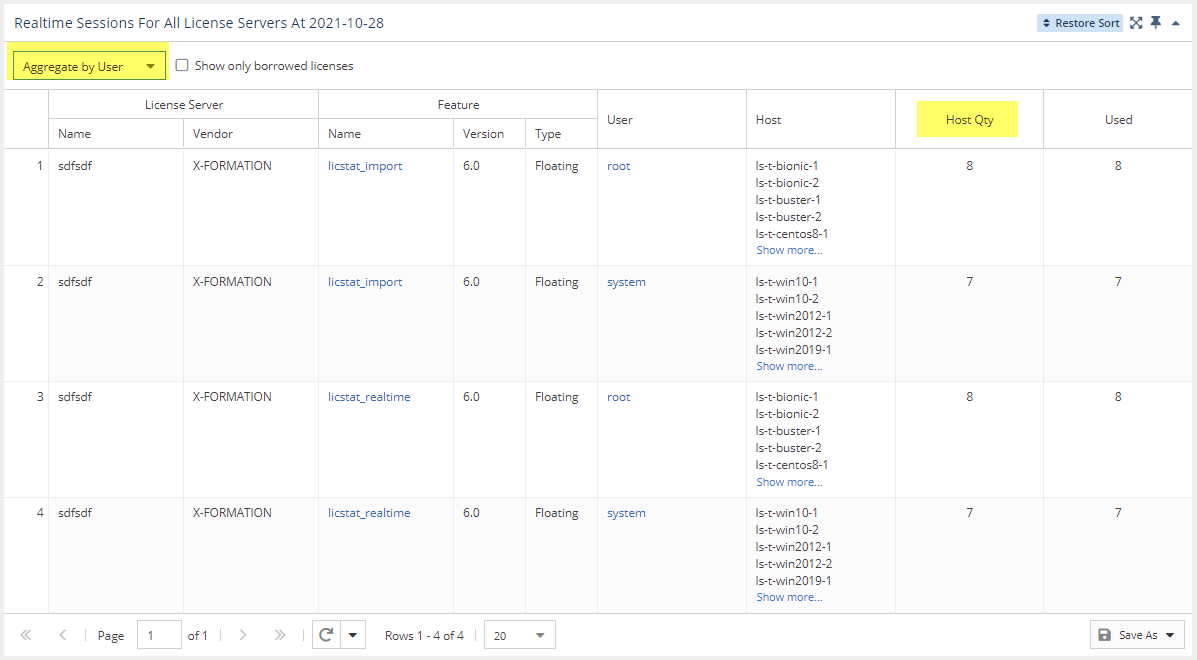
Current usage on multiple hosts
To see current usage occurring on multiple hosts in the Realtime Sessions grid, aggregate the report by user, and ensure the "Host Qty" column is visible.
Borrowed licenses
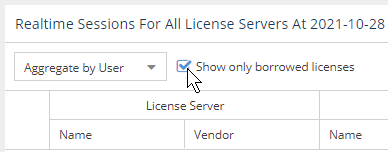
To see currently borrowed licenses, toggle on "Show only borrowed licenses" at the top of the Realtime Sessions grid.