...
You can add the Realtime Sessions report's chart and grid to the License Statistics Dashboard using the pin at the top right of the pane. Learn more about customizing the Dashboard.
Realtime License Usage graph
The top section of the Realtime Sessions report contains a Realtime License Usage graph that gives you a visual picture of the number of licenses currently in use, and by which users, giving you instant understanding of highest license usage per user.
...
See Feature usage graphs for additional information about feature use graphs.
Realtime Sessions grid
The lower section of the Sessions report contains a Realtime Sessions grid. This grid shows current usage of all licenses for the selected feature.
...
Using this grid, you can see information such as:
- Usage by a specified time range
- Usage occurring for individual users on multiple hosts
- Borrowed license usage
These uses are described below.
Anchor time_range time_range
Current usage by time range
| time_range | |
| time_range |
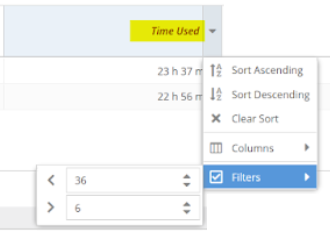
To see current usage by time range in the Realtime Sessions grid, make sure the "Time Used" column is visible, and filter by the desired time range. For example, you can filter by greater than 6 hours and less than 36 hours to see all results that are within this time range, as illustrated below.
Anchor hosts hosts
Current usage on multiple hosts
| hosts | |
| hosts |
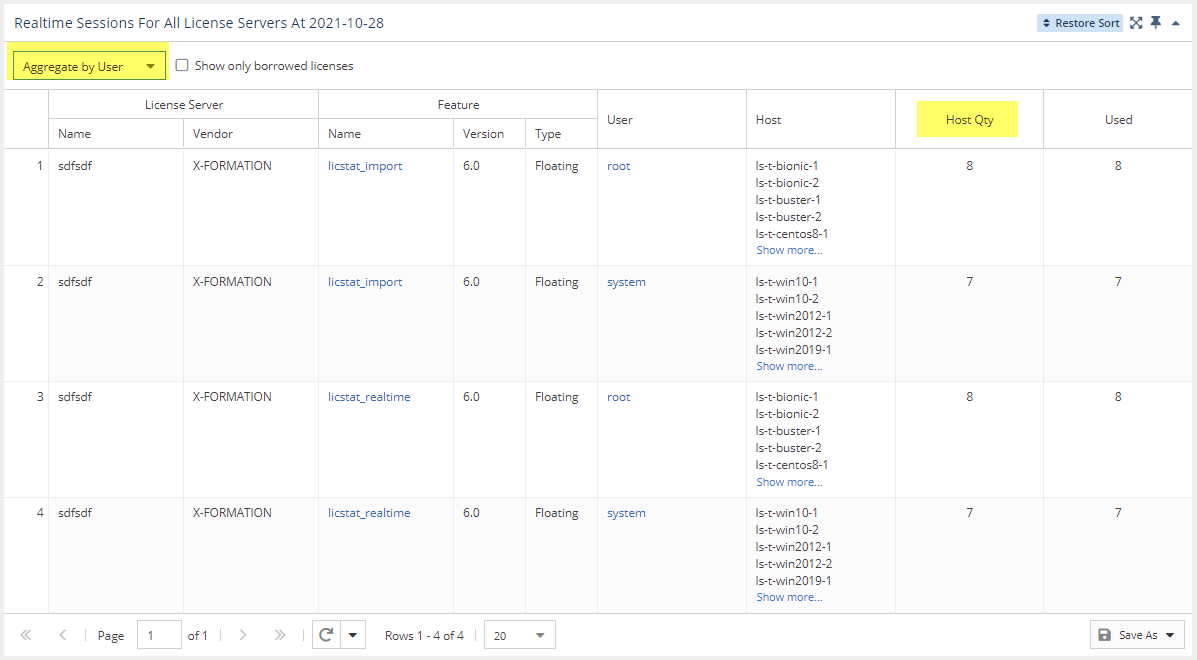
To see current usage occurring on multiple hosts in the Realtime Sessions grid, aggregate the report by user, and ensure the "Host Qty" column is visible.
| Anchor | ||||
|---|---|---|---|---|
|
To see currently borrowed licenses, toggle on "Show only borrowed licenses" at the top of the Realtime Sessions grid.
...