The information on this page refers to License Statistics v6.15 and newer, which changed the behavior of hovering over Features page graphs. If you are using a version previous to v6.15, see documentation for previous versions. |
The graphs in the Features pages give you a visual picture of your license utilization. Points on the graphs indicate the number of licenses used during the indicated time period.
General use of graphs in the Features pages is covered below.
Viewing details in Feature page graphs
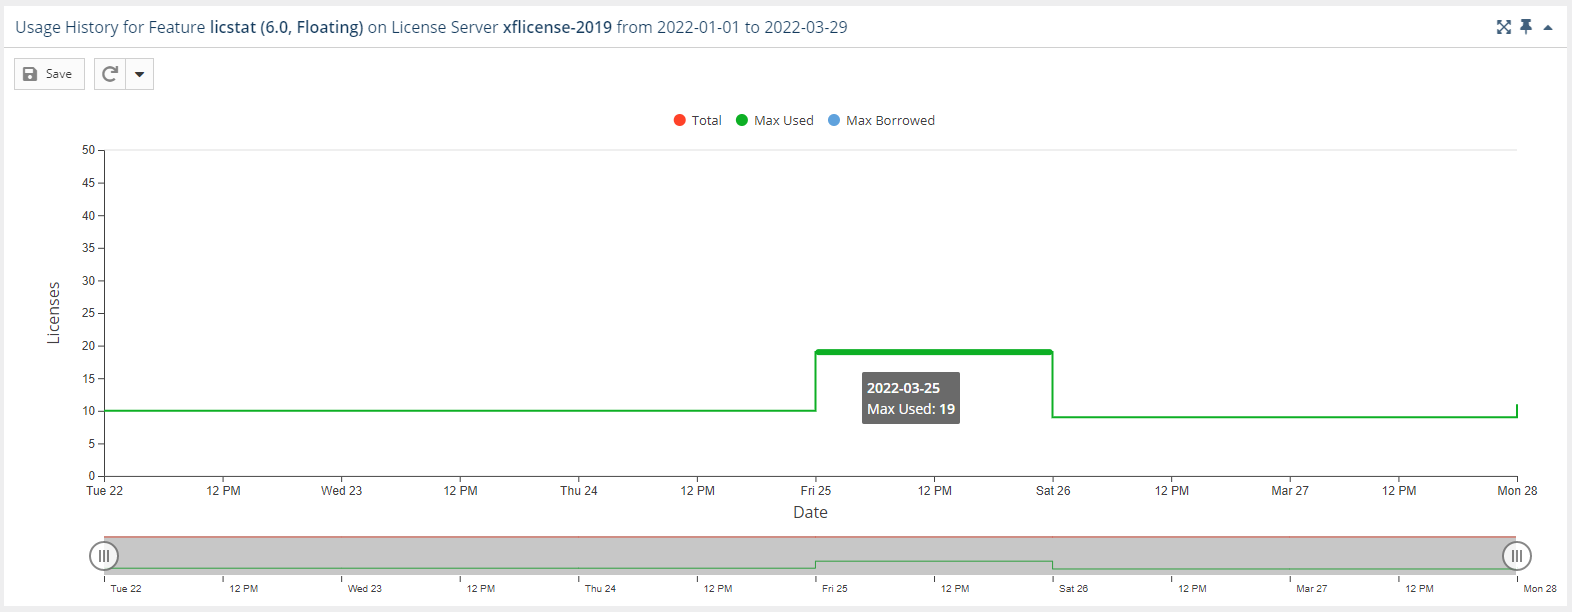
For Sessions and Usage graphs, hovering over the graph will display a labeled list that shows the following information (as applicable to the data being reported):
- date and time
- number of available, used, and borrowed licenses
- time of usage (for graphs that report time)
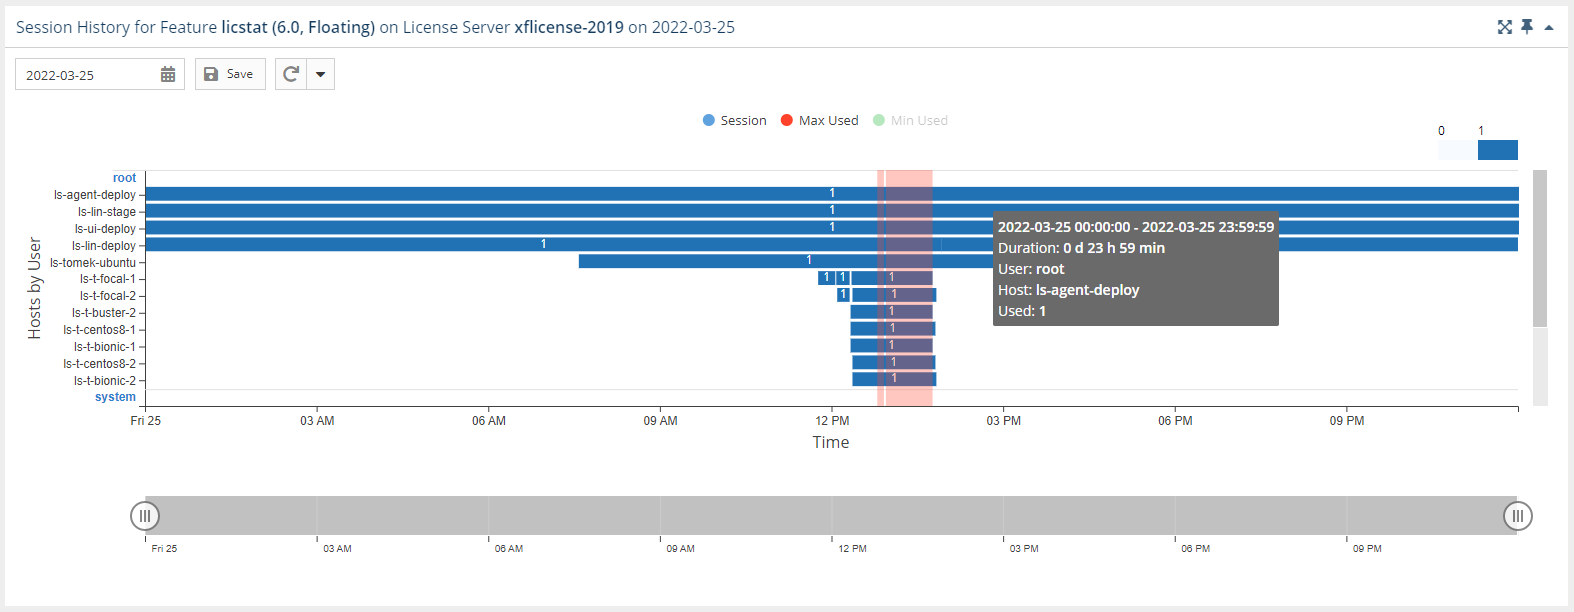
The appearance of this information is illustrated in the Feature Usage History and Feature Session History examples below.
Hiding or showing the display of selected usage details on the graph
You can control the display of selected usage details for each graph by clicking the value for which you want to view data in the legend at the top of the chart. For example, clicking the "Total" option on the graph legend will remove the line showing the number of total licenses.
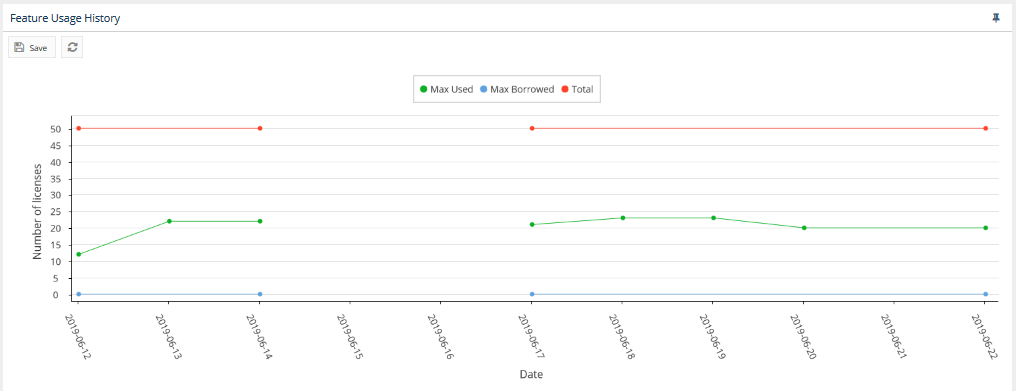
The following graph has total license display disabled (grayed out).
Gaps in collecting data
Empty spaces or "gaps" in the chart indicate periods when License Statistics was not running and data was not being gathered. This can happen due to one or more of the following reasons:
- The status of the license server has changed
- An error message about the server status has been recorded in the error log
- License Statistics has been stopped
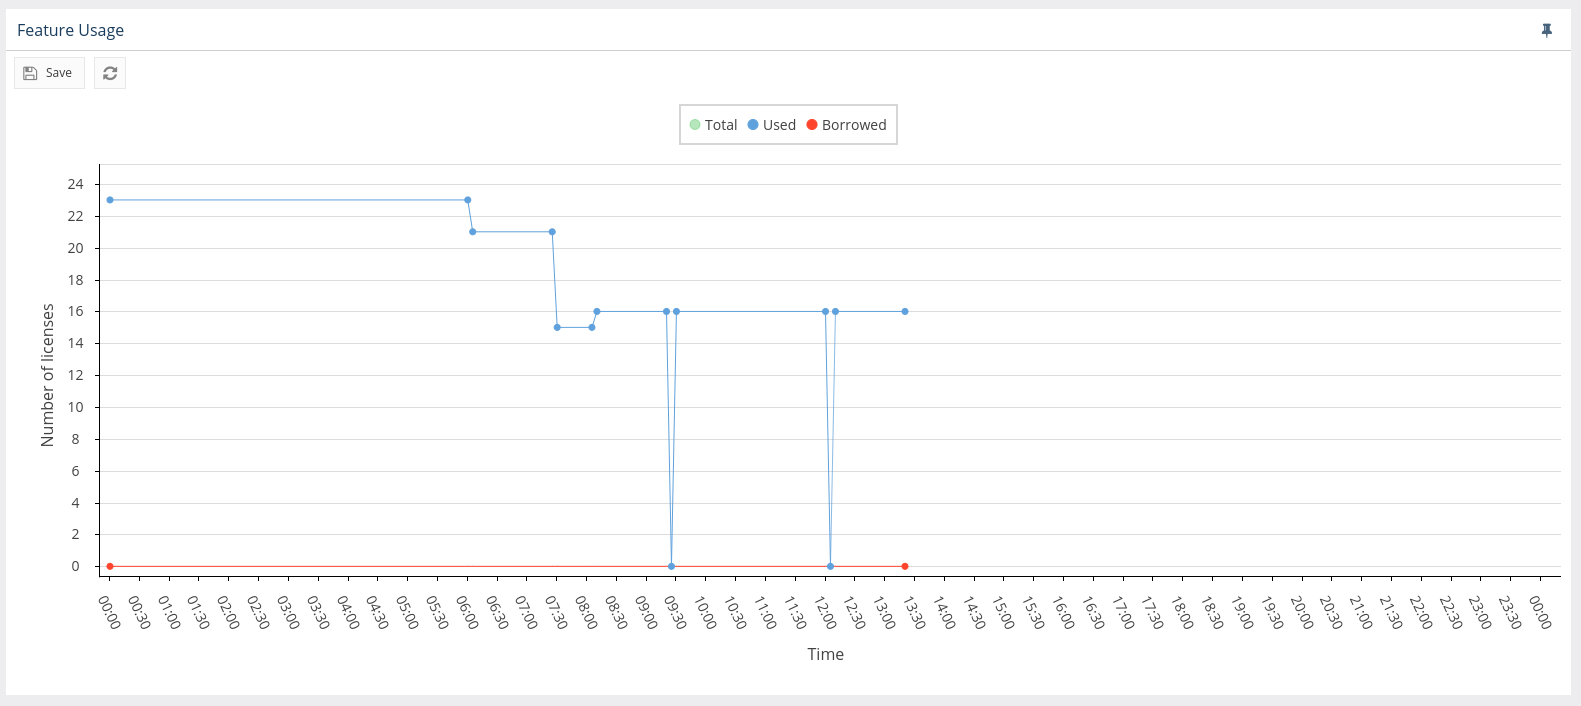
The following graph shows periods when data was not collected.