The information on this page refers to License Statistics v4.12 or newer, which made general improvements to the Usage Per Usage grid. If you are using an earlier version, please refer to the documentation for releases prior to v4.12. |
To see a report on usage per user, select the Usage Per User tab from the Reports page.
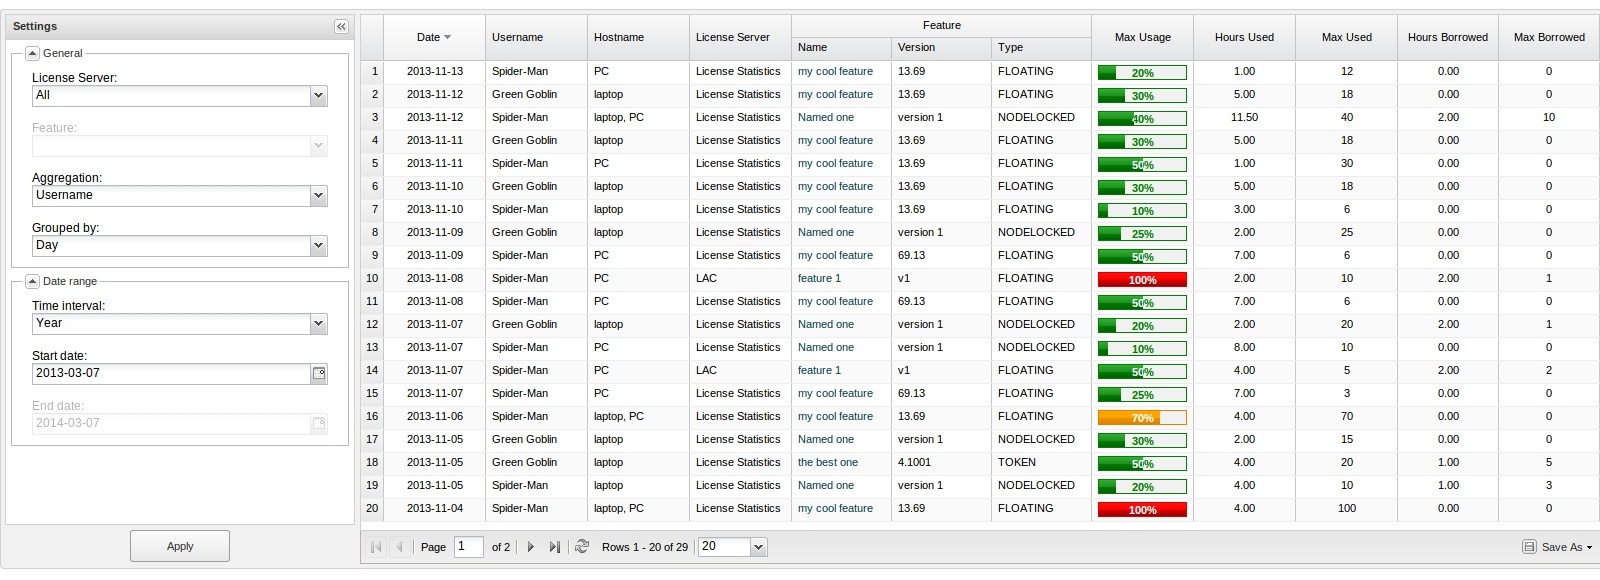
The Usage Per User report lets you monitor license usage for a selected type of aggregation to use for the report (described below). With this report, you can change time constraints as appropriate for your needs; for example, you can display license usage information based on monthly usage, but limit the results shown to weeks.
It is worth noting that the Usage Per User report may serve as a warning signal, letting you see the overall trend of license usage based on peak license usage. Therefore, you can consider if the values represent a one-time event or a recurring event that begins to look like a trend.
Types of aggregation
You can specify the type of aggregation by which you aggregate the results for the report. If the aggregation type is not specified, the report will be aggregated by Username and Hostname. Available options are:
Note: The Usergroup and/or Hostgroup options may be disabled, indicating that no groups have been created.
How aggregation is applied in a report
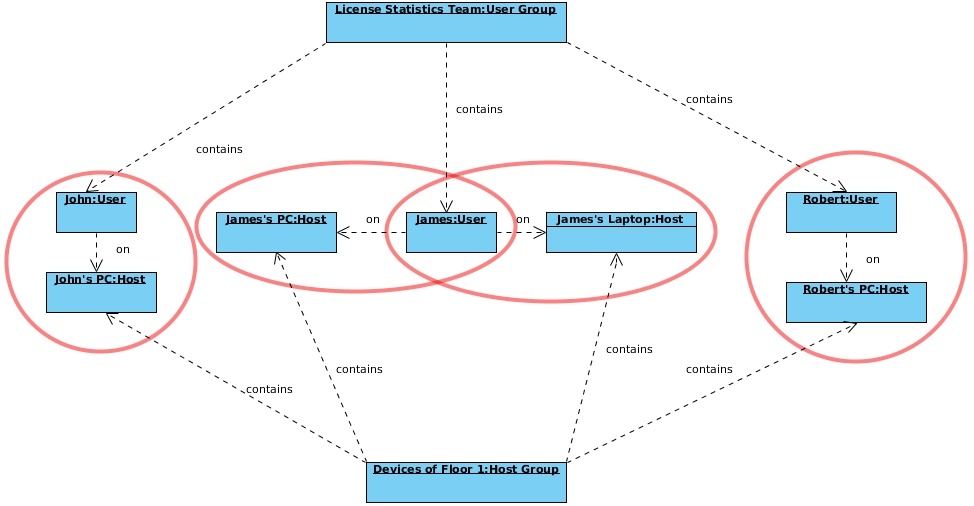
Aggregation enables you to specify detailed levels of the produced results. License usage information can be displayed for a specified entity, letting you juxtapose one set of data with another.
The following diagram shows how License Statistics aggregation options are used by real-world entities in a company.
Types of grouping (time units)
Depending on your needs, you can group feature usage information by the following units of time:
- Day
- Week
- Month
- Quarter
How grouping by a unit of time works in a report
Grouping by a unit of time lets you group values from specified fields together. For example, license usage information can be limited to a month and within that month displayed based on daily usage. Grouping works in the same way for all other available time units, for any set of selected values.
Feature Usage Information
The feature usage information includes the following:
| Column Name | Description |
|---|---|
| Date | A particular day or period of time, whose format depends on the selected grouping option.
|
| Hostname | A single hostname of a list of hostnames where license usage took place. |
| Username | A single username or a list of usernames. |
| Usergroup Name | The name of a group of users. |
| Hostgroup Name | The name of a group of hosts. |
| Hours Used | The number of hours at least one license of a particular feature was used and/or borrowed. |
| Hours Borrowed | The number of hours at least one license of a particular feature was borrowed. |
| Max Used | The maximum number of licenses used in a particular time period. |
| Max Borrowed | The maximum number of licenses borrowed in a particular time period. |
| Max Usage | The maximum allowed level of feature usage, expressed in percentages. |
Date Range
The Start Date, End Date, and Time Interval fields for which you wish to display license usage are interdependent, i.e. modifying the Start Date field affects the End Date field, depending on the selected Time Interval option. If you select the "Custom" option in the Time Interval options, then both fields (Start Date and End Date) can be modified; however, you will not be able to select the day earlier than the Start Date on the End Date field, and later than the End Date on the Start Date field, because the value on the other field will be automatically adjusted.