| The information on this page refers to License Statistics v6.15 or newer, which improved the usability of the License Usage History chart. If you are using an earlier version, please refer to the documentation for earlier versions. |
The information given on this page applies to both Licensing Model 2013 and Licensing Model 2019.
This page covers information about where to look for licensing details in the License Statistics v6.x UI. For complete details about each of the licensing models, see:
For information on switching from Licensing Model 2013 to Licensing Model 2019, see License Transition.
Licensing page
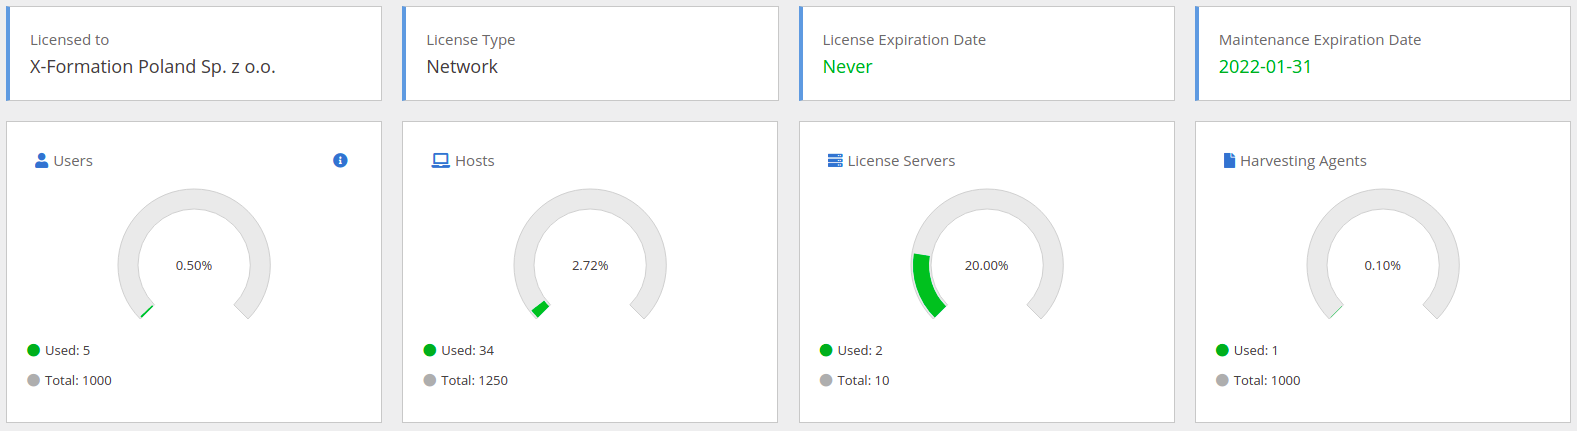
The Licensing page under the Administration section gives you details about your License Statistics license, including how user and license server licenses are being consumed, license limits, license type and expiration date.
Gauge charts
When license usage is within your license limits, the gauge charts at the top of the Licensing page will be green, as illustrated below.
You can easily see when your license limits are exceeded or nearing threshold (90% and above), indicated by red in the gauge charts.
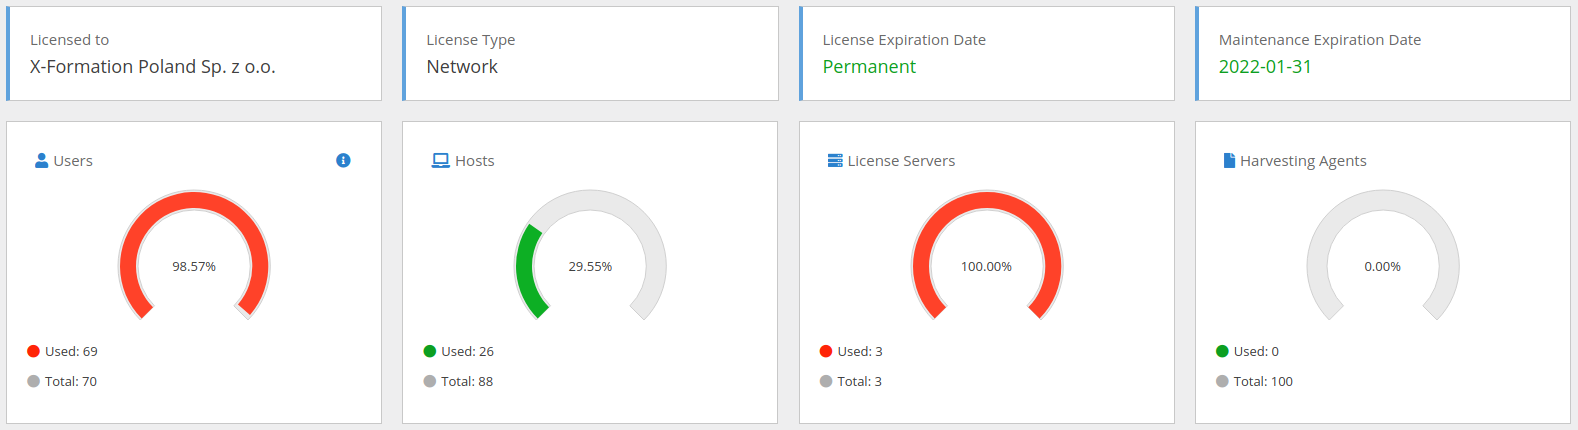
The Hosts gauge reports the number of hosts monitored for the entire database. The Total value is 125% of the Users gauge's Total value, which is the threshold unless a High Performance Computing (HPC) license is being used.
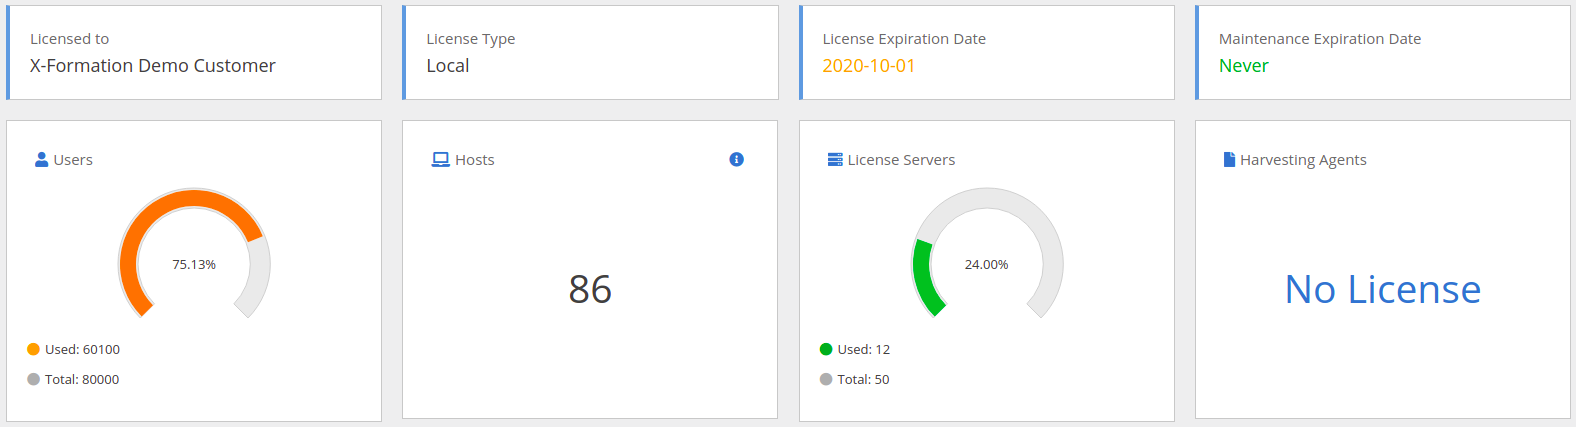
If an HPC license is in use, the threshold on allowed number of Hosts is lifted, and the Hosts information will look similar to the following illustration.
If there are no Harvesting Agents included in the license, the information will look similar to the following illustration.
For the Licensing Model 2013:
- Both Realtime and Imported license details are available. In this case, there is also a panel displaying values needed to switch the licensing to the Licensing Model 2019.
- The Hosts information is not included.
License Usage History chart
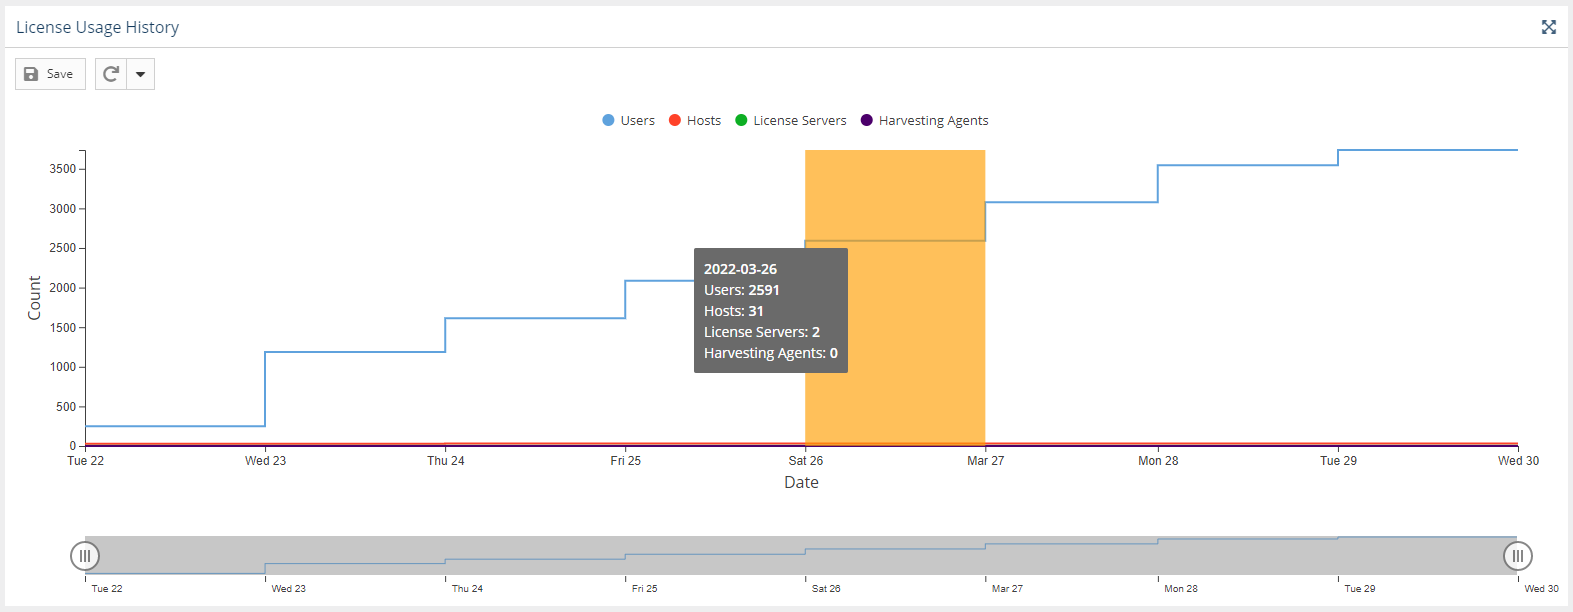
The License Usage History chart in the Licensing page reports historical usage of the License Statistics license.
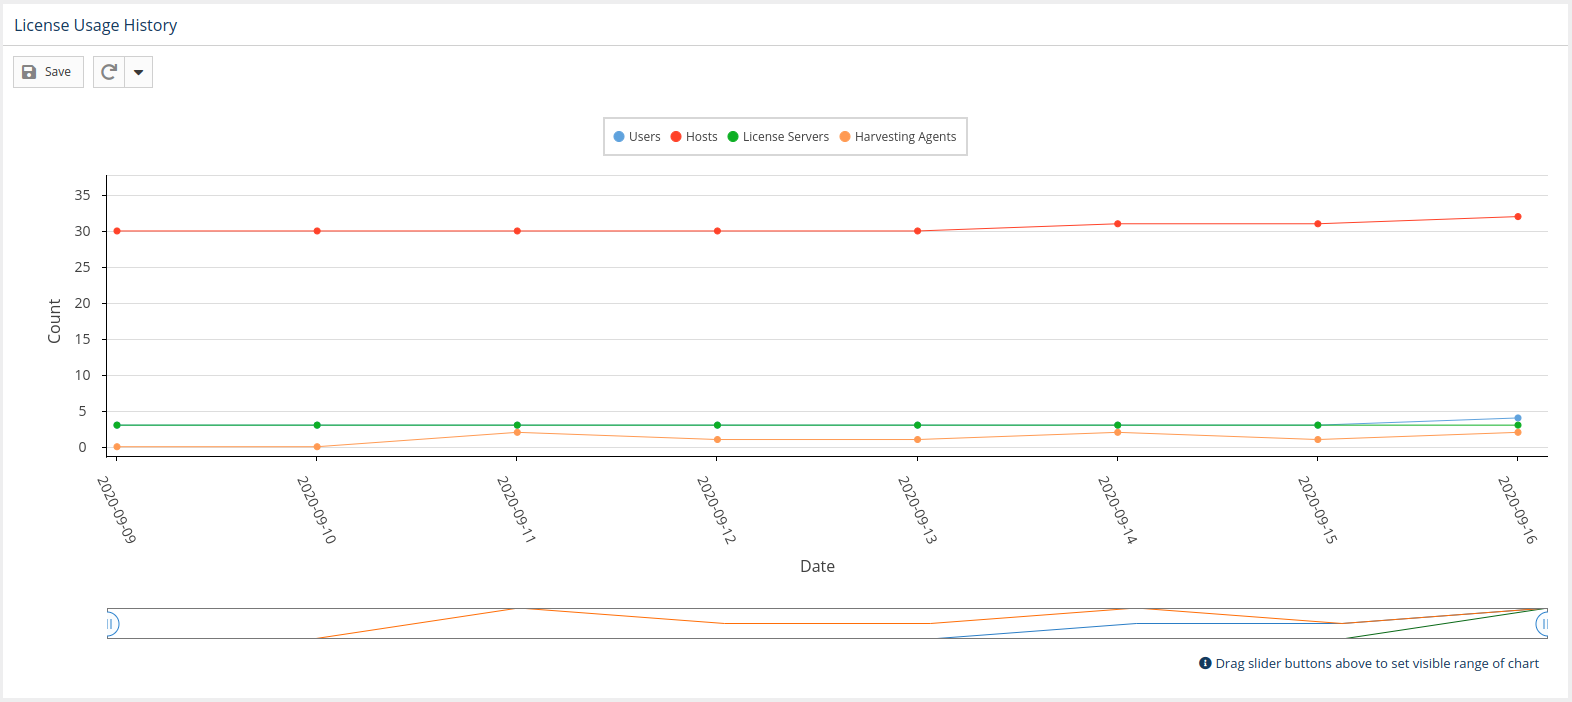
Data is shown up through the current day by default. To see details for a specific time period, click on the end-date for the time period in the chart. (Days will be highlighted as you move your mouse over the chart.)
You can limit the information to only the users/hosts who are new (were not included in usage for previous days) by toggling on Show only new users/hosts.
The information shown in the License Usage History chart depends on your licensing model, as described below.
Licensing Model 2019
The License Usage History chart for the Licensing Model 2019 includes the following information.
- Number of all users in the database up through the selected date
- Number of all hosts in the database up through the selected date
- Number of maximum concurrent license servers in each day
- Number of Harvesting Agents in each day
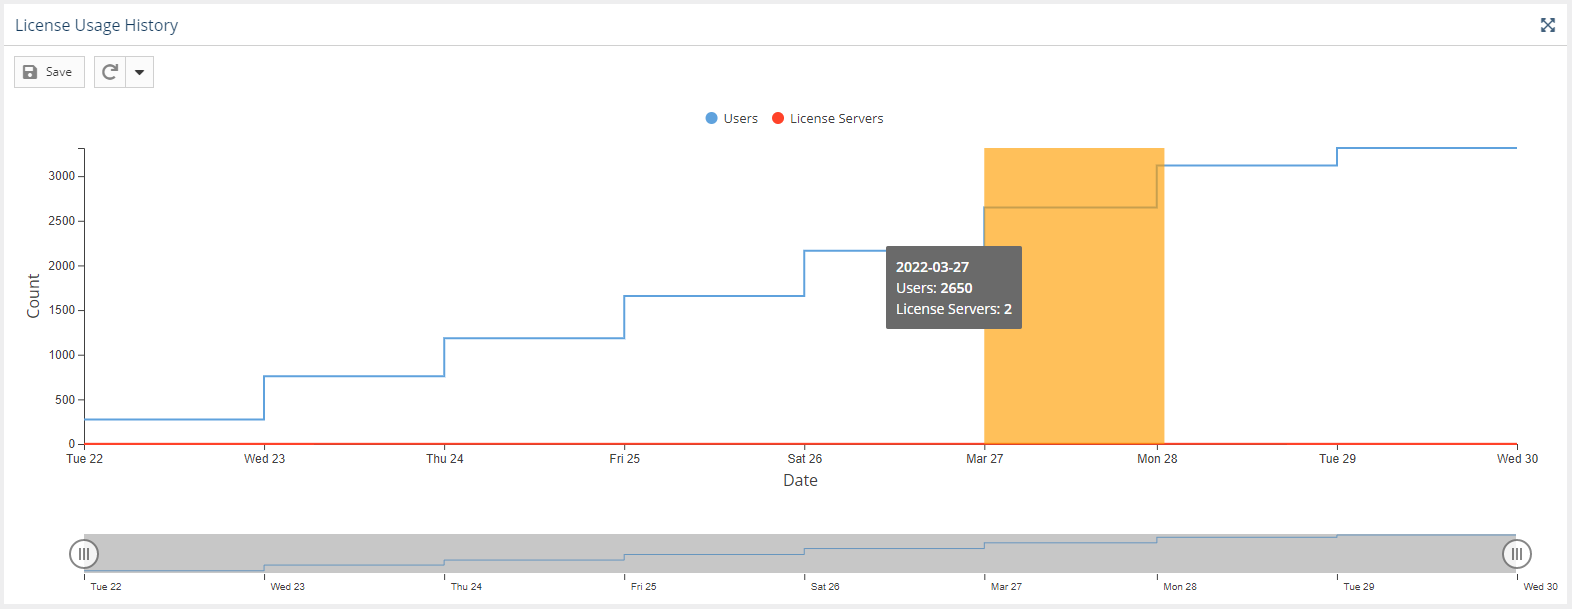
Licensing Model 2013
The License Usage History chart for Licensing Model 2013 includes the following information.
- Number of users or user-hosts for the last 14 days
- Number of maximum concurrent license servers in each day
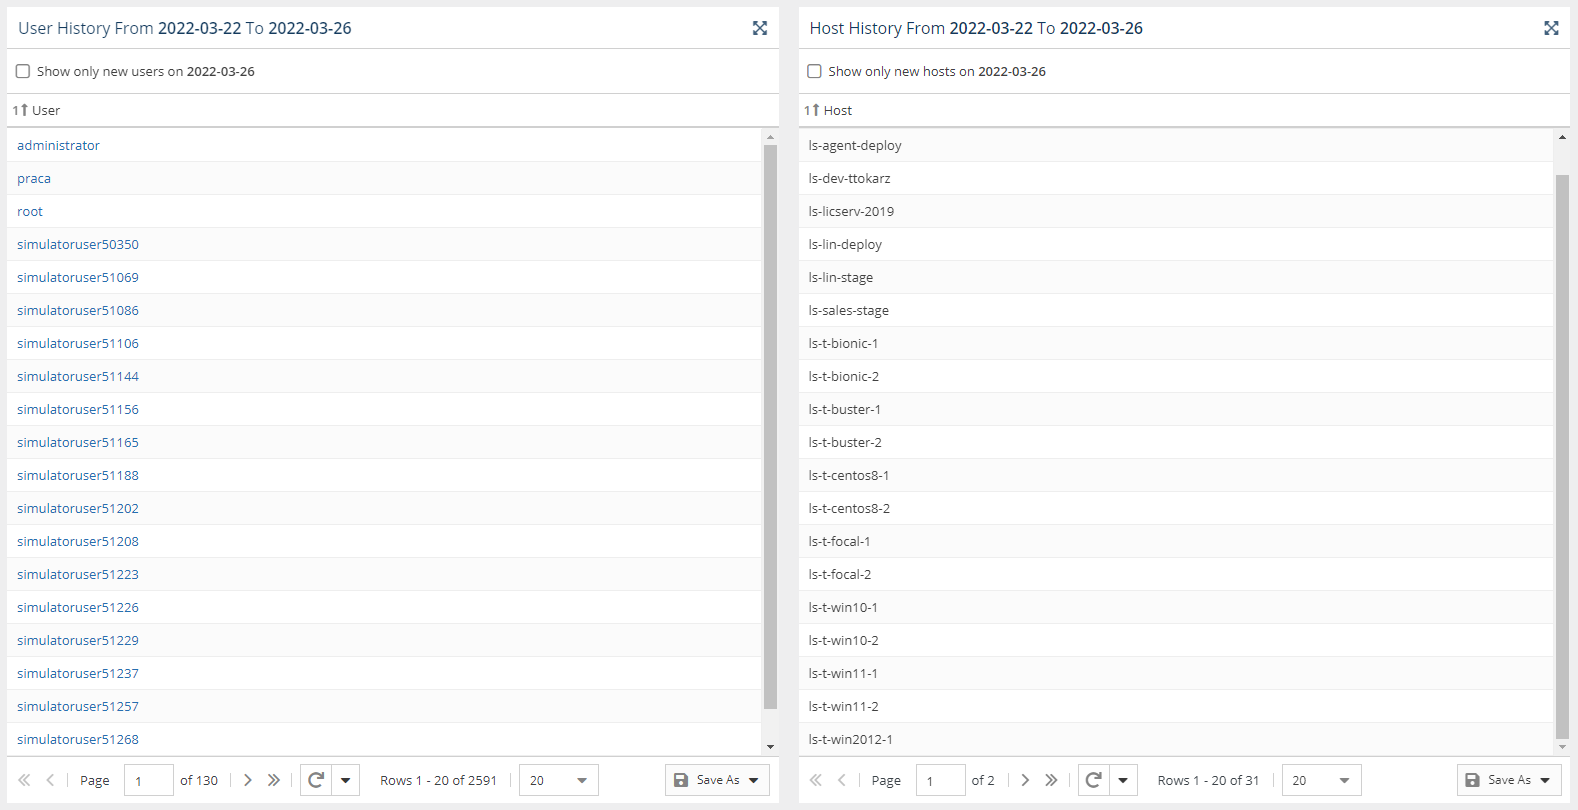
User History grid
The User History grid displays license usage history up to the date selected in the License Usage History chart (or the current date if none is selected).
The information shown in the User History grid depends on your licensing model, as described below.
Licensing Model 2019
For the Licensing Model 2019, separate User History and Host History grids display license usage history from the beginning of the database to the selected date (current date by default).
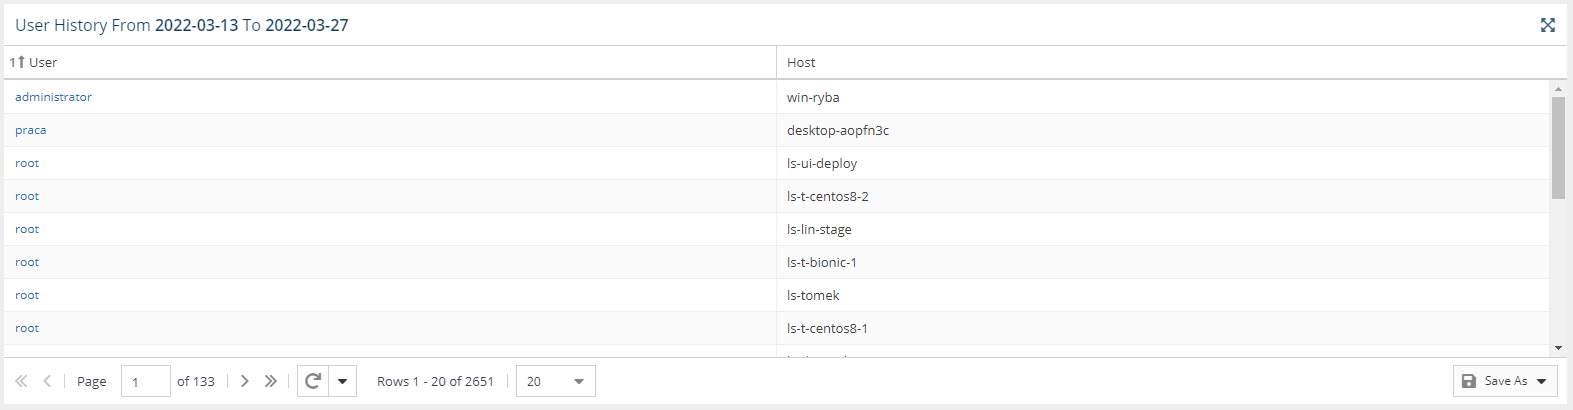
Licensing Model 2013
For the Licensing Model 2013, a User History grid with user-host pairs displays license usage history for 14 days (by default) prior to the selected date (or current date if none is selected) up through the selected date.
License usage notifications
A popup notification will alert you if you are reaching your licensed limit for users/hosts. The notification is activated at 80%, 90%, and 95% usage thresholds, as those thresholds are exceeded. For example, after exceeding the 80% threshold, a notification similar to the following will popup on the screen:

You can:
- Click OK to dismiss the notification for the current threshold level for 1 day.
- Click Dismiss to dismiss the notification for the current threshold level for 7 days.
A new notification will appear if a higher threshold is exceeded, regardless of dismissal. For example, if you dismiss a notification for reaching the 80% threshold, a new notification will appear within that dismissal period if the usage exceeds 90%.