| Warning |
|---|
This |
...
page refers to functionality that has been removed from License Statistics |
...
. Reports have been restructured and reorganized as of License Statistics v6.14. The contents of the User History report have been moved to Features - History - Sessions. |
The User History page under the Features section in the left navigation pane
...
From the Features page, the User History tab shows statistics for license usage by user, during any period that usage was tracked.
General Information
The General Information area at From the top of the pageincludes identifying information for the feature, the last update time, a share code if sharing is in use (for example, "Shared on: HOST"), and the license type.
Use the License Server and Feature pick lists in the General Information area to this page, select the license server and feature for which you want to view the user history. You can also select "All" from the License Server pick list to view all license servers.
Filtering results
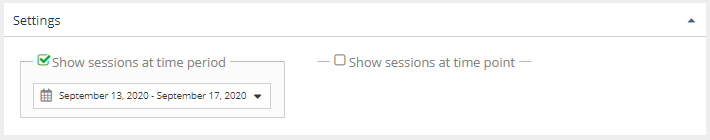
You can use the Settings area to filter results by users that had a license checked out at a specified date and time or you can choose the time period for which you want to view the usage history from the Settings panelthe time period or by a specific date and time, as described below.
Showing sessions for a particular time period
To specify a time period for which to view usage history, check the “Show sessions at time period” box in the Settings panelarea.
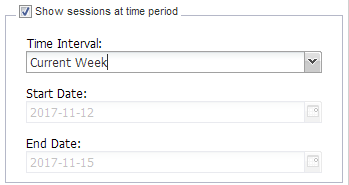
Time intervals include:
- Current or Last Year
- Current or Last Quarter
- Current or Last Month
- Current or Last Week
- Today
- Yesterday
- Custom (which lets you enter a specific start and end date)
For example, you can view sessions only for the current week by selecting "Current Week" from the Time Interval time interval drop-down list, as shown below.
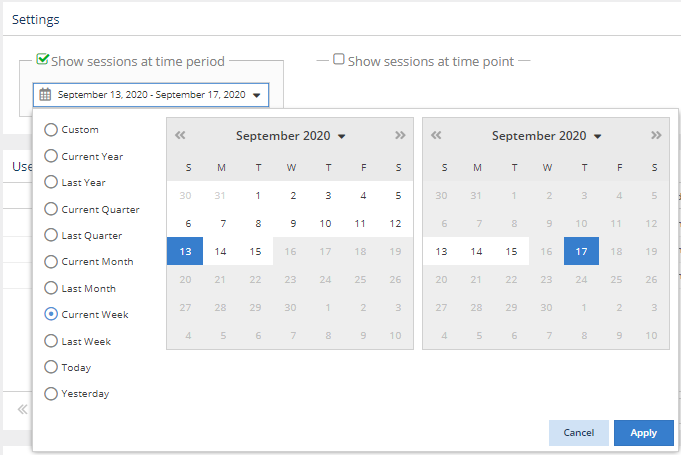
When you select "Custom" as the Time Intervaltime interval, the reports will include all user sessions that:
- Started between 00:00:00 and 23:59:59 on the start date
- Finished between 00:00:00 and 23:59:59 on the end date
- Started before 00:00:00 on the start date, and:
- finished after 23:59:59 on the end date or
- for realtime license servers, the sessions are still active or
- for
- finished after 23:59:59 on the end date or
...
- imported license servers, there is no
...
- data about the end time of the session
...
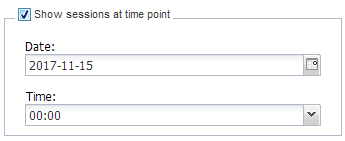
Showing sessions for a particular point in time
To specify the precise date and time for which you want to view the user history, check the “Show sessions at time point ” box in the Settings panelarea. For example, if you adjust the settings as shown below, your report will include sessions for all users that were checking using licenses at 00:20 on 2015-10-13.
General Information
12:00 (noon) on September 1, 2020.
The General Information area includes identifying information for the feature, the last update time, a share code if sharing is in use (for example, "Shared on: HOST"), and the license type. 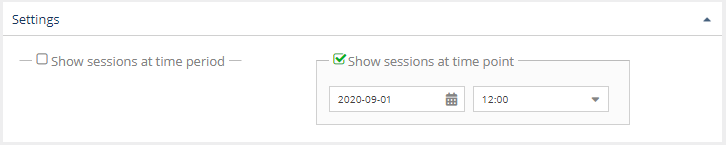
User History grid
The User History grid shows the usernameuser, hostname host and start and end times the feature was used. Start and end times define the time a given user on host used at least one license. For realtime license servers, if the user still has the feature checked out, the End Time will state "Still in use". For imported license servers, if we don't have information about the end time of the session, the End Time will state "Unknown".
You can add the User History report to the License Statistics Dashboard. Learn more about customizing the Dashboard.
User History grid versus Usage Per User report
...
| Scenario | User History Grid Results | Usage Per User Report Results |
|---|---|---|
| User_A checks out 4 licenses at one time using Host_1. | One row lists the User_A, Host_1 pair. The data does not include number of licenses checked out. | One row lists User_A, aggregated by Username. Includes number of licenses used at the same time (4) in the "Max Used" column. |
| User_A checks out 1 license using Host_1, returns the license 15 minutes later, then checks out the license again 5 minutes later. | Two rows list the User_A, Host_1 pair. The data does not include number of licenses checked out. | One row lists User_A, aggregated by Username. Includes number of licenses used at the same time (1) in the "Max Used" column. |
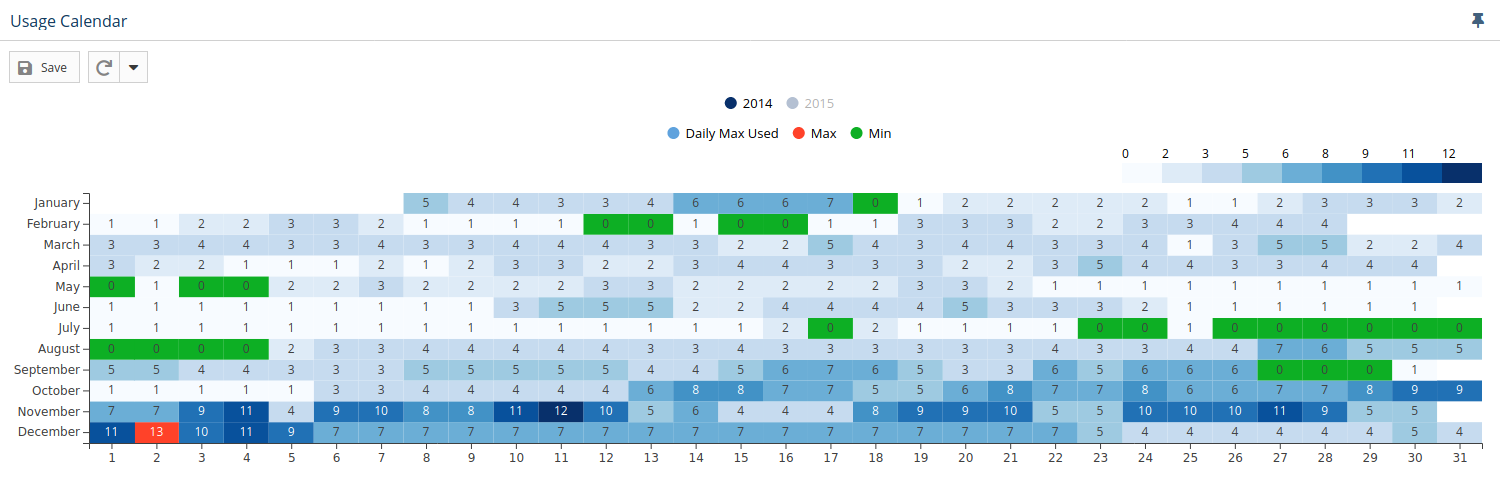
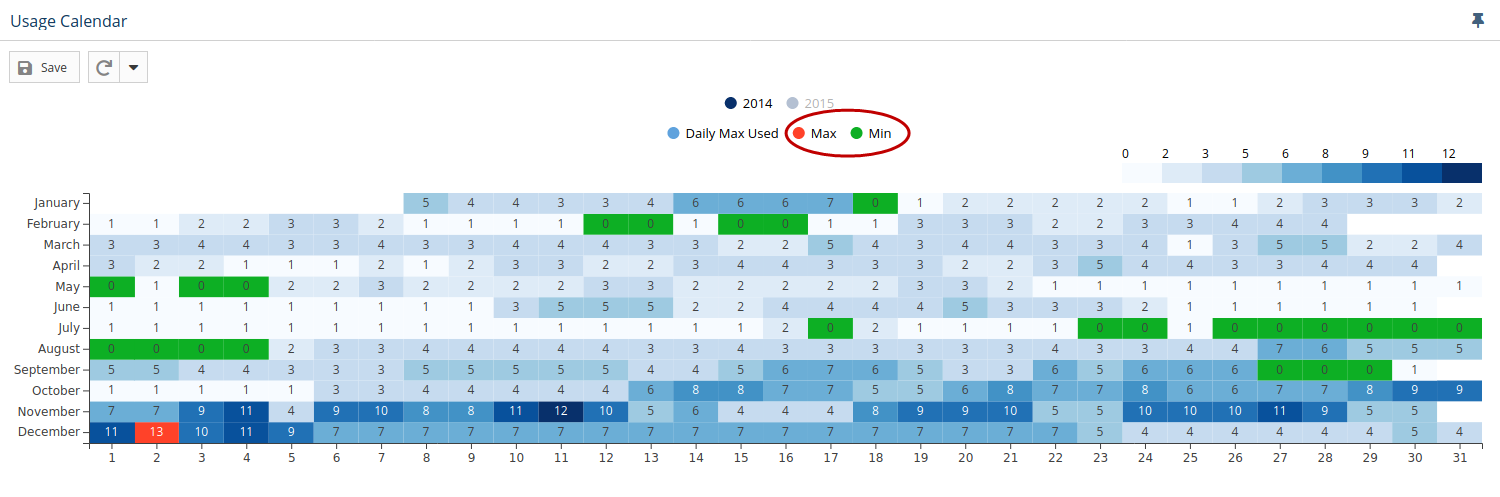
Usage Calendar
The Usage Calendar includes usage for each day in the selected range (see Filtering results, above). The Usage Calendar shows the daily maximum usage of licenses per feature. The legend at the top right of the chart shows the color coding for the number of licenses (in the illustration below, 0 to 12).
Viewing data for multiple years
If multiple years are selected for the time period, only one year is displayed at a time. To see the data for the year you are interested in, select the year from the top of the chart.
For example, the illustration below shows data gathered for 2014 and 2015, with 2014 being displayed. At the top of the chart, "2015" is grayed out, indicating that it is not currently displayed. To display data for 2015 instead of 2014, you would click on "2015" at the top of the chart.
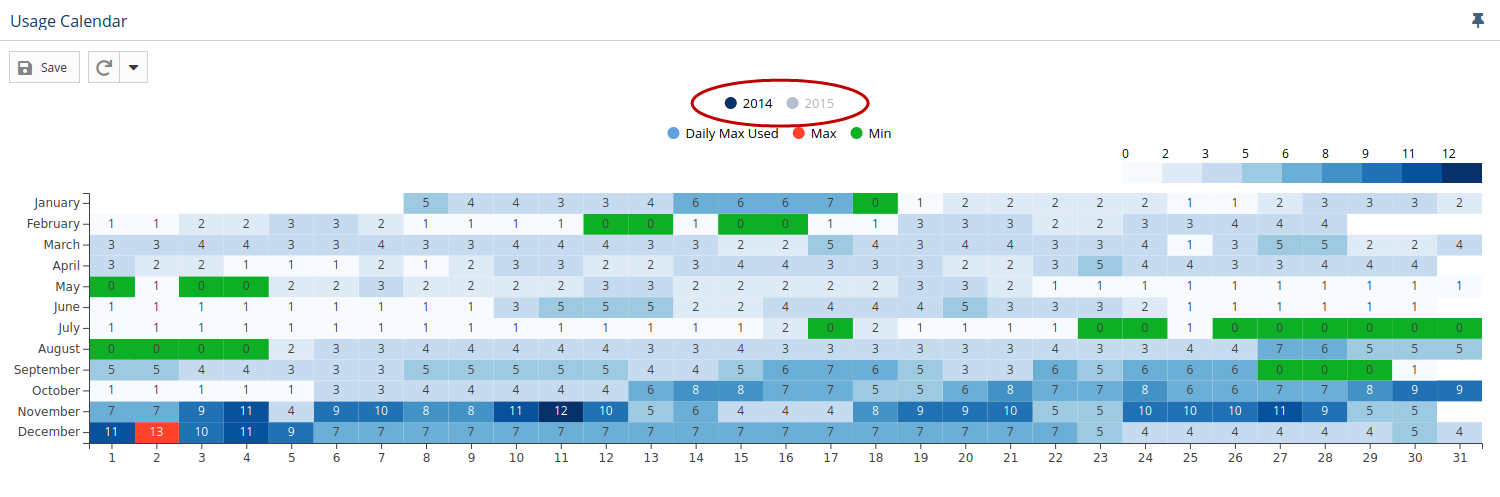
Controlling level of detail
You can control the level of detail shown in the chart using the Max and Min toggles at the top of the chart.
For example, you may be interested in viewing only maximum usage, and in this case, can toggle off the "Min" display so the chart shows only the maximum usage. The illustration below is displaying all detail.
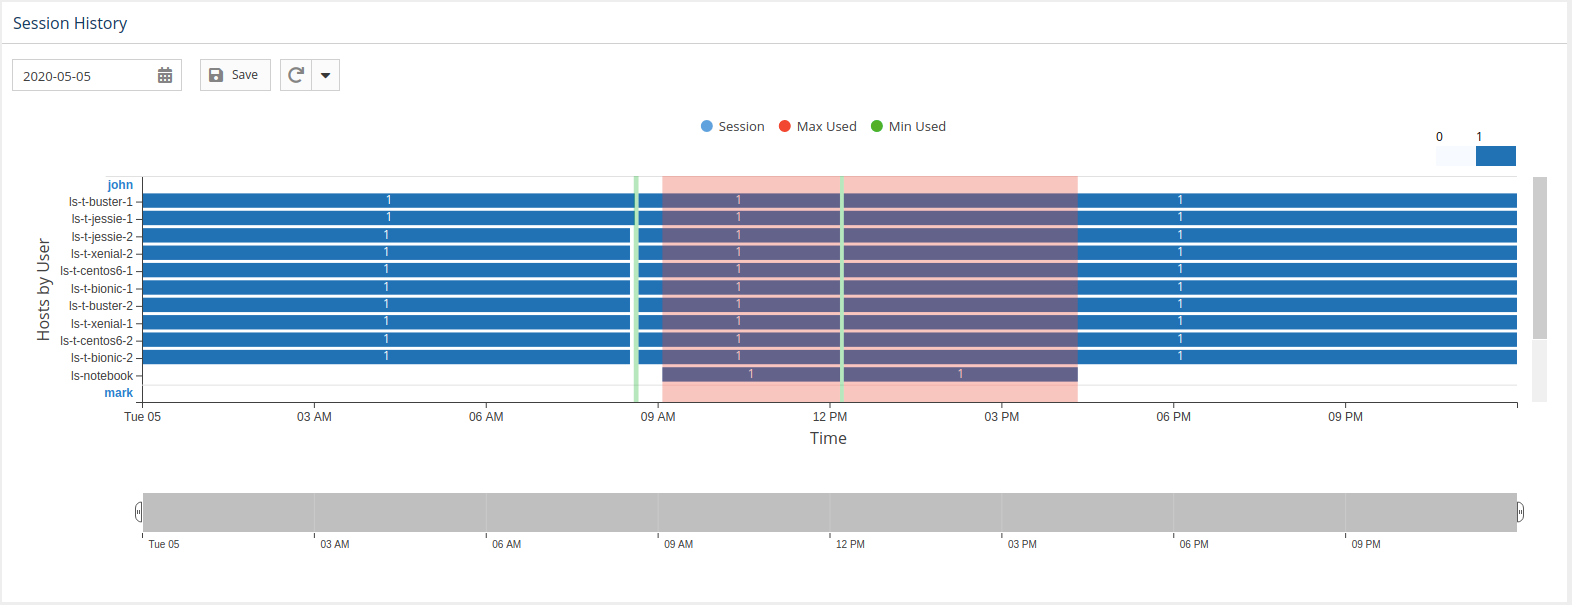
Anchor sessions_history sessions_history
Sessions History chart
| sessions_history | |
| sessions_history |
The Sessions History chart supplies fine detail for usage by showing each user session for the specified license server and feature time precision dependent on the query interval or imported log details (see Filtering results, above). You can select a particular day to view by selecting a day from the Usage Calendar chart or by using the calendar tool at the top left above the chart.
The Session History chart lets you easily see the day when the maximum usage of a particular feature occurred, the hours that usage occurred, and the users and hosts that consumed the licenses.
- The X axis is a time range (hours in 1 day).
- The Y axis is a list of users and hosts.
- You can highlight any session to see its details, including the number of licenses consumed by the user on the host and the time range for the session.
- The level of detail can be controlled using the Max and Min toggles at the top of the chart, in the same manner as described above for the Usage Calendar.
- You can select the max/min fields to see details including the sum of licenses consumed at peak of usage and the time range for the usage.
- As for the Usage Calendar, the legend at the top right of the chart shows the color coding for the number of licenses (in the illustration below, 0 to 1).