...
The information on this page refers to License Statistics v6.13 19 and newer, which added current time to the Feature Usage graph and allows selection of "All" license servers when selecting which license servers to view from the General Information areaintroduced the ability to remotely close sessions. If you are using a version previous to v6.13, see documentation for previous versions.an earlier version, please refer to the documentation for earlier versions. |
The Sessions The Current Usage page under the Features: Realtime section in the left navigation pane shows the currently open sessions and realtime usage statistics for the currently selected license/server feature or all license servers.You can also select "All" from the License Server pick list to view all license servers.
General Information
The General Information area at the top of the Current Feature Usage page includes identifying information for the feature and a summary of usage information for the selected feature.
Use the License Server and Feature pick lists in the General Information area to select the license server and feature for which you want to view current usage. You can also select "All" from the License Server pick list to view all license servers.
Use the License Server and Feature pick lists in the General Information area at the top of the report to select specific license servers and features for which to view current usage. You may also choose to view all license servers, or all features for a selected license server by selecting "All" from the pick lists. (When "All" is selected from the License Servers pick list, feature selection is unavailable.)
You can add the Realtime Sessions report's chart and grid to the License Statistics Dashboard using the pin at the top right of the pane. Learn more about customizing the Dashboard.
Realtime License Usage graph
The top section of the Realtime Sessions report contains a Realtime License Usage graph that gives you a visual picture of the number of licenses currently in use, and by which users, giving you instant understanding of highest license usage per user.
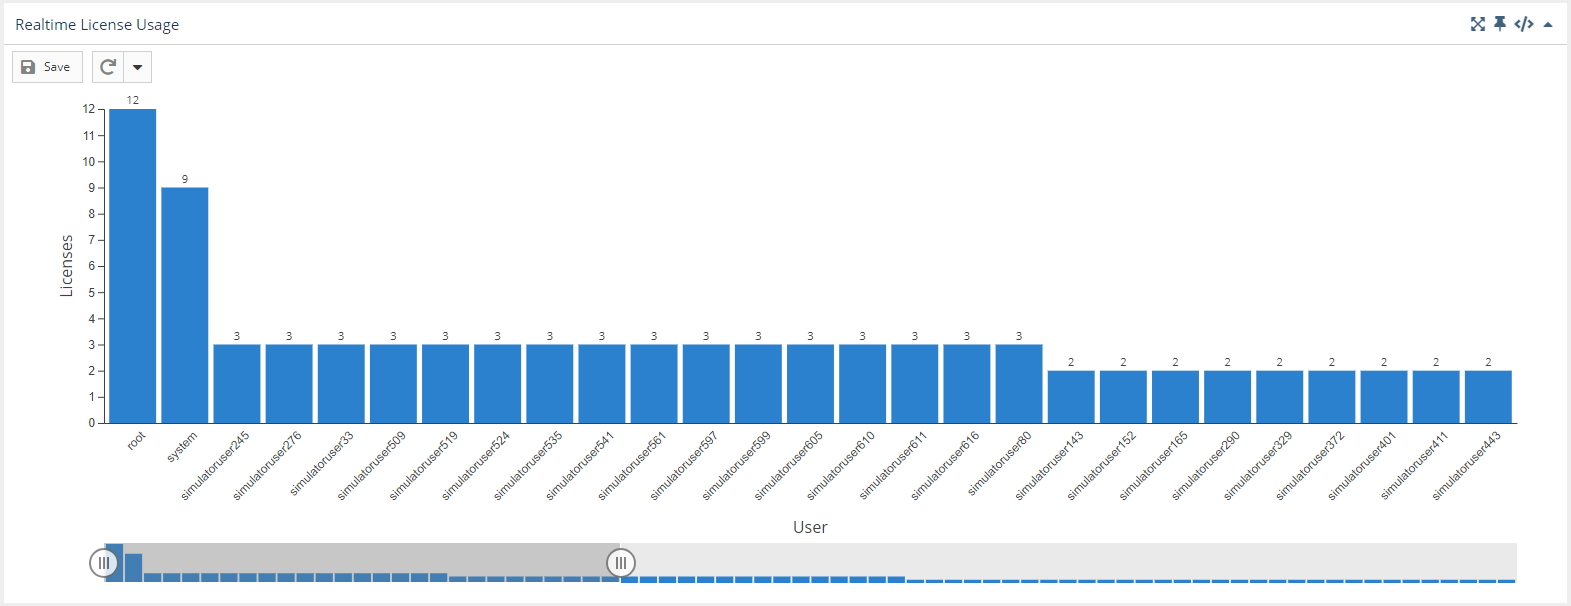
The slider at the bottom of the graph lets you restrict the results to the users you want to focus on (for example, you might use the slider to view only those users with more than 1 license in use).
If you select a license server/feature for which there is no realtime data, a popup with a link to view the history data for that license server/feature will appear in the upper right corner of the window.
See Feature usage graphs for additional information about feature use graphs.
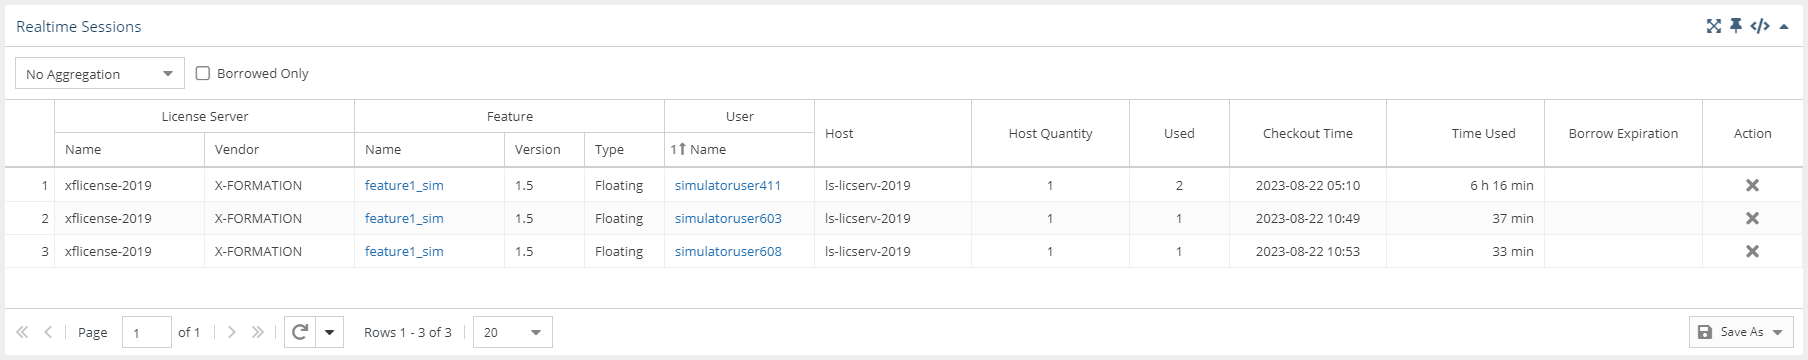
Realtime Sessions grid
The lower section of the Sessions report contains a Realtime Sessions grid. This grid shows current usage of all licenses for the selected feature.
The Realtime Sessions grid includes the user and host The Current Feature Usage list includes the user and host (and Host IP, hidden by default) on which the selected feature is checked out, how many licenses that user has checked out, the checkout time(s) and how much time has elapsed since checkout, and for any borrowed licenses, when the borrow time expires.

You can add the Current Feature Usage grid to the License Statistics Dashboard. Learn more about customizing the Dashboard.
Feature Usage graph
The Feature Usage graph gives you a visual picture of the number of licenses used throughout the day. (See Reports: Feature usage graphs for additional information about feature use graphs.)
You can hide or show total, used and borrowed licenses. The display of these usage details in the graphs is controlled by clicking the status for which you want to view data in the legend at the top of the chart. For example, clicking the "Total" option on the graph legend will remove the lines showing the number of used licenses.
The graph below displays the number of borrowed and used licenses; the display of total licenses is hidden (grayed out). A vertical line (the orange line in the illustration below) shows the current time.

Gaps in collecting data
Empty spaces or "gaps" in the graph indicate periods when License Statistics was not running and data was not being gathered. This can happen due to one or more of the following reasons:
- The status of the license server changed to "Offline"
- License Statistics tried to connect to the license server to gather data, but the server was temporarily unavailable
You can add the Feature Usage graph to the License Statistics Dashboard. Learn more about customizing the Dashboard.
Filtering results
...
Using this grid, you can see information such as:
- Usage by a specified time range
- Usage occurring for individual users on multiple hosts
- Borrowed license usage
These uses are described below.
Anchor time_range time_range
Current usage by time range
| time_range | |
| time_range |
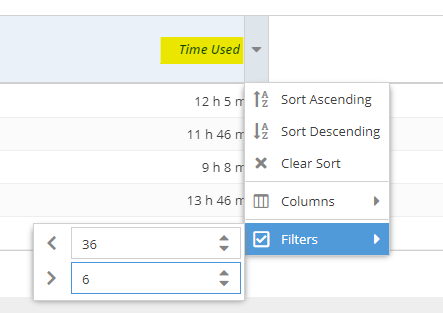
To see current usage by time range in the Realtime Sessions grid, make sure the "Time Used" column is visible, and filter by the desired time range. For example, you can filter by greater than 6 hours and less than 36 hours to see all results that are within this time range, as illustrated below.
Anchor hosts hosts
Current usage on multiple hosts
| hosts | |
| hosts |
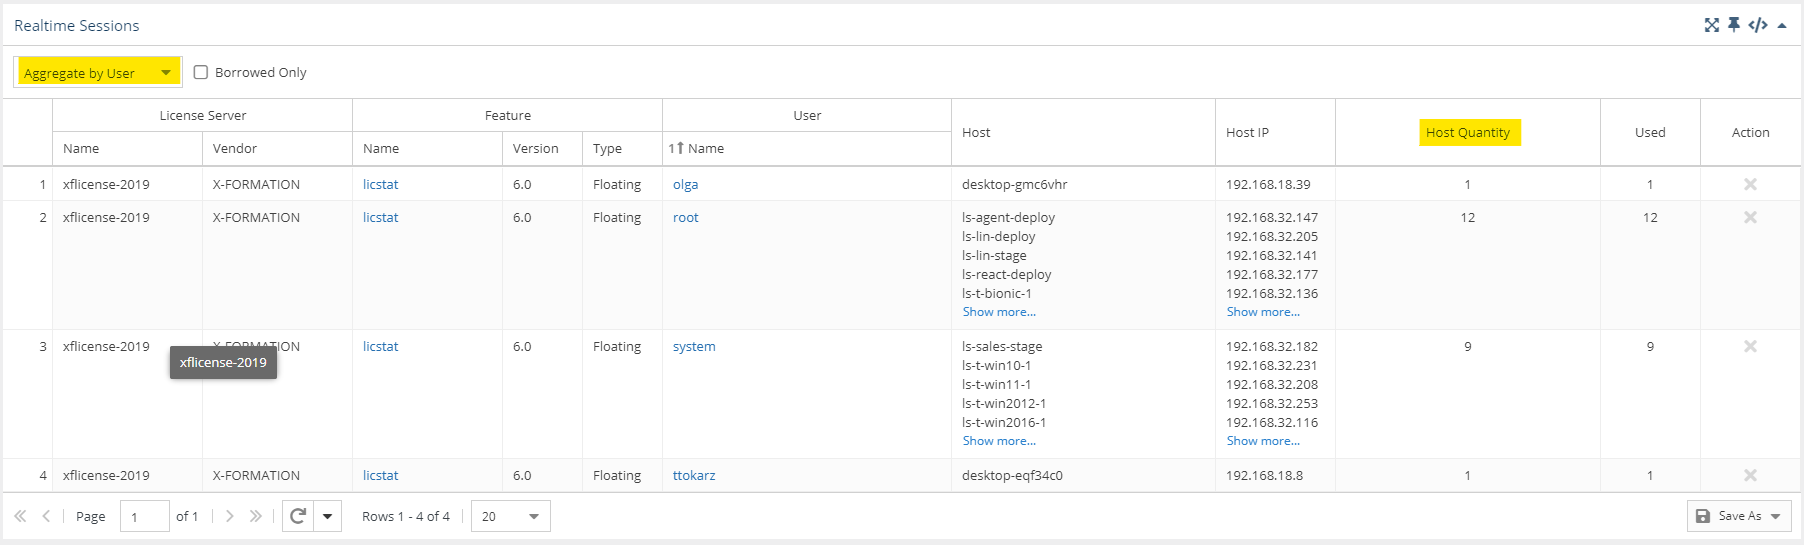
To see current usage occurring on multiple hosts in the Realtime Sessions grid, aggregate the report by user, and ensure the "Host Qty" column is visible.
| Anchor | ||||
|---|---|---|---|---|
|
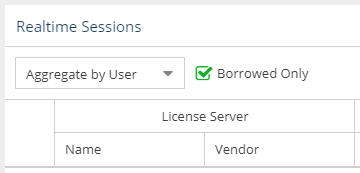
To see currently borrowed licenses, toggle on "Borrowed Only" at the top of the Realtime Sessions grid.
Remote session closing
You can remotely close a session using the "X" in the Action column at the right end of the session's row in the Realtime Sessions grid.
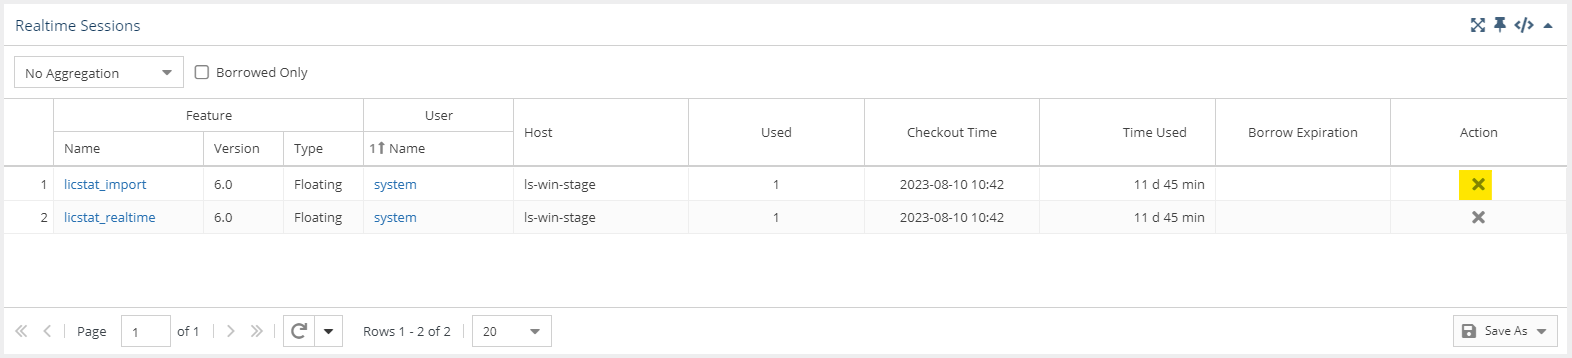
Similar to closing sessions using License Harvesting, when you manually close an application on the end-user host, License Statistics will automatically force the session to release on the corresponding license server and return the license to the available pool.
| Info |
|---|
| This setting is applicable only for LM-X and FlexNet license manager types. |