The information on this page refers to License Statistics 6.0 and newer, which introduced a new user interface (UI). If you are using a version previous to v6.0, see documentation for previous versions. |
Apart from measuring license usage on a group basis, License Statistics lets you see statistics for license usage by user, during any period that usage was tracked. You can gain insight into user performance on a daily basis for a specific feature by using the Features - History - Sessions report.
Example
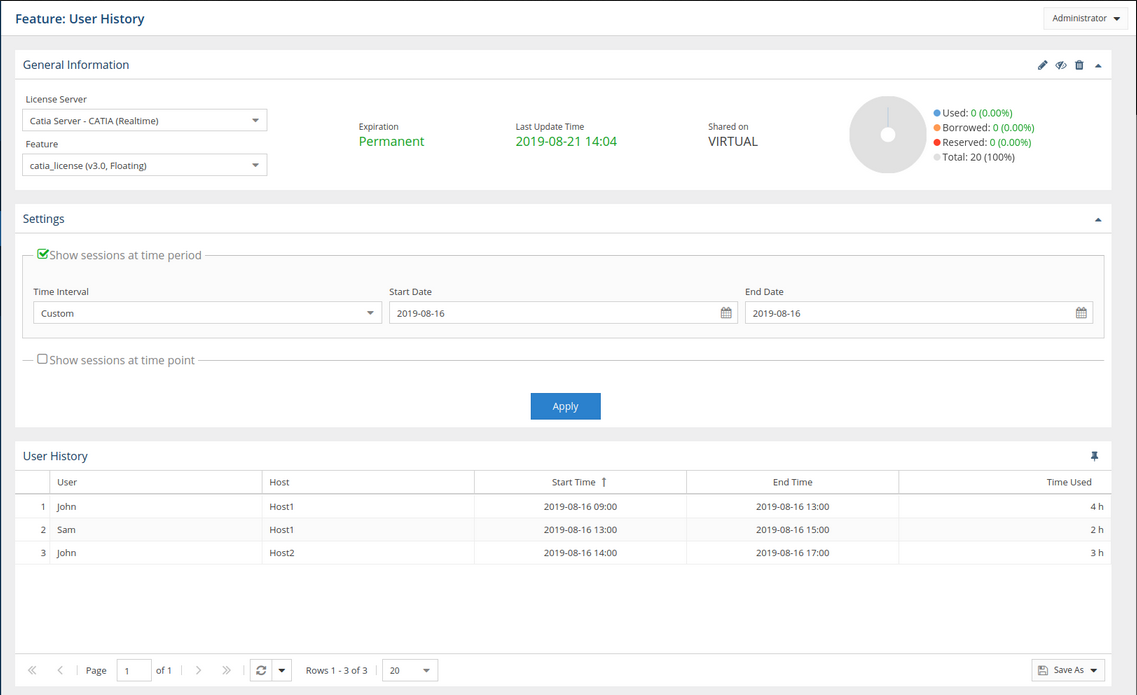
On the 16th of August 2019, user John begins working at 09:00. He starts up his application, checks out two licenses on Host 1, and works until 1:00, at which time he goes out for lunch. As soon as he leaves, his colleague Sam takes over John's work and keeps using Host 1 until 3:00. John returns to work at 2:00, at which time he checks out three licenses on Host 2. Finally, John finishes work at 5:00.
The following grid shows the users (John and Sam), hosts (Host 1 and Host 2) and start and end times the feature was used by the users.
Much as the above information is valuable, it is still incomplete; what we really want to know is how long John and Sam were using these licenses, i.e. what fraction of license time available to the company they used up. Therefore, what we need to see is:
John: 4 hrs x 2 licenses + 3 hrs x 3 licenses = 17 hours used
Sam: 2 hrs x 2 licenses = 4 hours used
The above value is relevant, because it is exactly what we are paying for. In other words, if we purchase 10 licenses for a month, we’re paying for 10 licenses x 30 days x 24hrs = 7200 license hours. And naturally, the goal is to utilize as much of these license hours as possible. Otherwise, we’re wasting money on licenses we’re not using.
Example 2
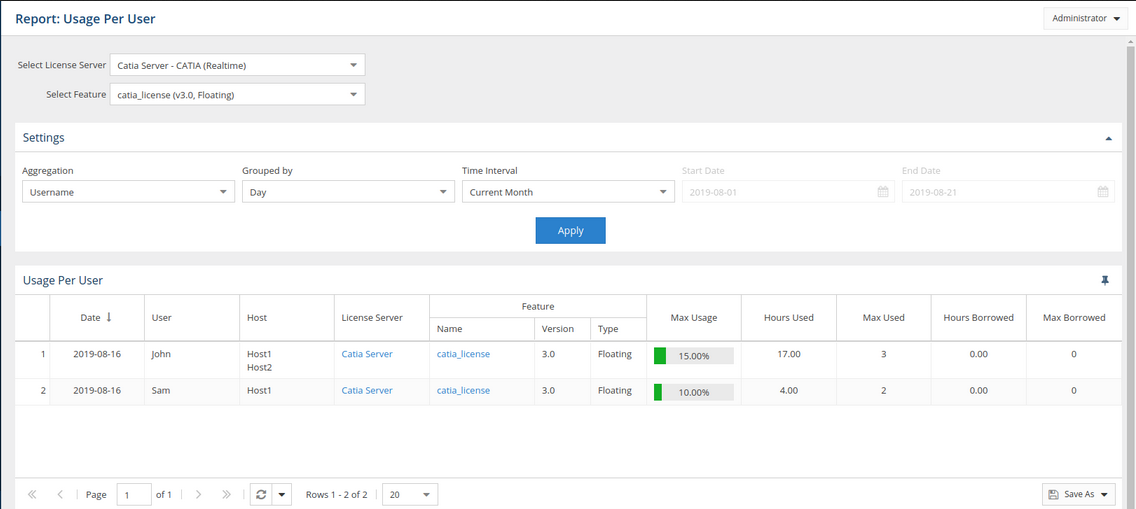
The same scenario would be handled differently in the Features - History - Usage Per User report, which lets you select the start and end dates; define whether you want to see daily, weekly, monthly, quarterly, or even yearly statistics; narrow down results using filters that include or exclude applications, users or groups; and control what the results look like. You can also apply several other filters to be get fine-grained results that give you exactly the usage facts that interest you.
The above grid shows that user John used licenses that were checked out for a total of 17 hours (from 9:00 to 1:00 and then from 2:00 to 5:00), and that the number of licenses used at the same time ("Max Used") was 3. We can also see that the maximum level of feature usage ("Max Usage") was equal to 15%. User Sam, on the other hand, used licenses between 1:00 and 3:00, so the number of hours used was 4.
For information about current license usage, see Measuring current license usage.

