The information on this page refers to License Statistics v6.15 and newer, which added new columns of information to the Usage Per User grid. If you are using a version previous to v6.15, see documentation for previous versions.

The Usage Per User report under the Features: History section in the left navigation pane shows license usage for a selected type of aggregation, as described below. In this report, you can change time constraints as appropriate for your needs; for example, you can display license usage information based on monthly usage, but limit the displayed results to weeks.

The Usage Per User report may serve as a warning signal, letting you see whether higher usage is a one-time or a recurring event based on overall trends of license usage based on peak usage. 

Types of aggregation

You can aggregate report results by:

By default, reports are aggregated by Username and Hostname.

If the User Group and/or Host Group options are disabled, this indicates that no groups have been created.

How aggregation is applied in a report

Aggregation enables you to specify detailed levels of the produced results. License usage information can be displayed for a specified entity, letting you juxtapose one set of data with another.

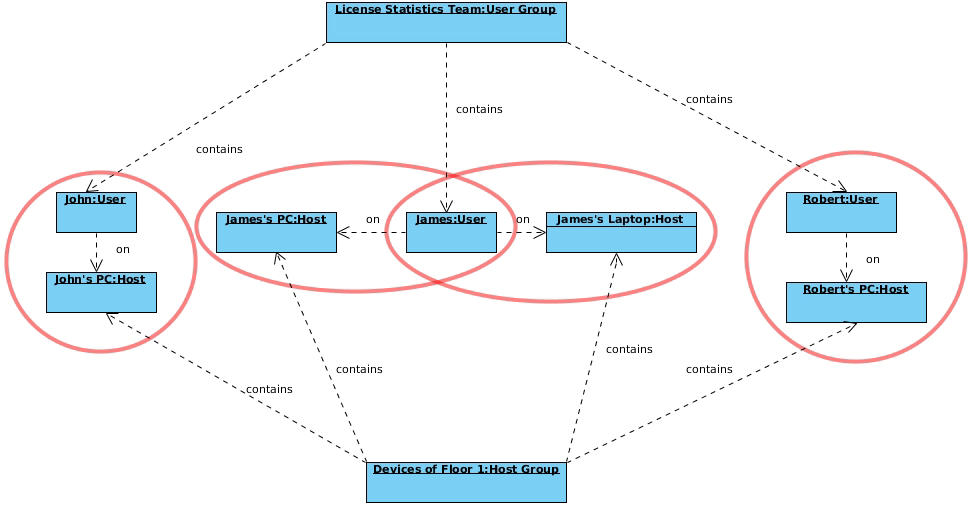
The following diagram shows how License Statistics aggregation options are used by real-world entities in a company.


Date Range

The Start Date, End Date, and Time Interval fields are interrelated; e.g., modifying the Start Date field affects the End Date field, depending on the selected Time Interval option. Selecting the "Custom" Time Interval option lets you specify the Start Date and End Date for the report. 

Types of grouping (time units)

You can group feature usage information by:

  • Day
  • Week
  • Month
  • Quarter
  • Year

How grouping by a unit of time works in a report

Grouping by a unit of time lets you group values from specified fields together. For example, license usage information can be limited to a month, and within that month displayed based on daily usage. Grouping works in the same way for all other available time units, for any set of selected values.

Let's assume the following values have been returned after grouping feature usage information by Day.

DateHours Used
2019-04-0110
2019-04-0220
2019-04-0430
2019-04-0640

When we choose to group the above feature usage information by Month and set the start date to April 4, 2014, we obtain the following values:

DateHours Used
2019-0470

When we decide to set the start date to April 1, 2014, we get the following values:

DateHours Used
2019-04100

Usage Per User grid

The Usage Per User grid includes the following:

Column NameDescription
Date

A particular day or period of time, whose format depends on the selected grouping option.

  1. Day: YYYY-MM-DD; for example, 2019-04-13.

  2. Week: YYYY-MM-DD - YYYY-MM-DD; for example, 2019-04-10 - 2019-04-16 (starts from Friday).

  3. Month: YYYY-MM; for example, 2019-04.

  4. Quarter: YYYY-Q[1-4]; for example, 2019-Q2.
  5. Year: YYYY; for example, 2019.
UserA single user or a list of users.
HostA single host or a list of hosts where license usage took place.
Host IPIP address for the host.
User Group
The name of a group of users. (This column will be displayed only if aggregating by User Group and one or more user groups exist.)
Host Group
The name of a group of hosts. (This column will be displayed only if aggregating by Host Group and one or more host groups exist.)

License server and
feature information

License server name and feature name, version and type.
Max UsageThe maximum allowed level of feature usage, expressed as a percentage.
Hours UsedThe sum of hours when licenses of a particular feature were used and/or borrowed.

Min Used

The minimum number of licenses used in a particular time period.
Avg UsedThe average number of licenses used in a particular time period.
Max UsedThe maximum number of licenses used in a particular time period.
Hours BorrowedThe sum of hours when licenses of a particular feature were borrowed.
Min BorrowedThe minimum number of licenses borrowed in a particular time period.
Max BorrowedThe maximum number of licenses borrowed in a particular time period.
DenialsThe number of denials that occurred in a particular time period.
TotalThe total number of licenses for the selected license server and feature.


To better understand possible aggregation scenarios, let’s look at the following example:

ColumnAggregation TypeScenario
Hours Used/BorrowedUsername

In our example, the results shown in the report are limited by Day.

Scenario 1 

The user uses 1 license for 8 hours.

Calculation: 8 hours = 8 Hours Used

Scenario 2

The user uses 2 licenses for 1 hour, then 10 licenses for 2 hours and 1 license for 2 hours.

Calculation: 2 hour  + 20 hours + 2 hours = 24 Hours Used

Max Used/BorrowedUsername

In this example, the results shown in the report are limited by Day.

Scenario 1

The user uses 2 licenses in the same time during the day.

Calculation: 2 licenses in the same time = 2 Max Used/Borrowed

Scenario 2

The user uses 1 license for an hour in the morning and 1 license for an hour in the afternoon.

Calculation: 1 license in the same time = 1 Max Used/Borrowed

Scenario 3

The user uses 1 license constantly for the entire day, while the other one is used only for 1 hour.

Calculation: 2 licenses in the same time = 2 Max Used/Borrowed
 

Max UsageUsername

In our example, the number of available licenses for a particular feature is 10.

Scenario 1

The user uses 2 licenses throughout the day.

Calculation: 2 licenses out of 10 licenses = 20%

Scenario 2

The user uses 5 licenses constantly for the entire day, except 1 hour when only 2 licenses are used. 

Calculation: 5 licenses out of 10 licenses = 50%

Scenario 3

The user uses 3 licenses constantly for the entire day, but additionally 5 licenses are used for 2 hours.

Calculation: 8 licenses out of 10 licenses = 80%