The information on this page refers to License Statistics v5.10, which added the ability to select a Time Interval and group by time period when filtering results. If you are running a previous version of License Statistics, please refer to documentation prior to v5.10. |
To see a report on usage history for a given license server, select the Usage History tab from the License Servers page.
The Usage History report shows statistics for license usage during any period that usage was tracked. The settings you make on this page (for example, filters) are retained for the next time you log into License Statistics.
To choose the license server for which to view statistics, use the License Server pick list in the Select License Server section at the top of the page. You can select either an individual license server or a license server group from the License Servers pick list.
The Usage History report lets you change time constraints as appropriate for your needs; for example, you can display license usage information based on monthly usage, but limit the displayed results to weeks.
Types of grouping (time units)
Depending on your needs, you can group values from specified fields together. For example, license usage information can be limited to a month and within a month displayed based on daily usage. Grouping works in the same way for all other available time units, for any set of selected values.
Feature Usage Information
The feature usage information includes the following:
| Column Name | Description |
|---|---|
| Date | A particular day or period of time, whose format depends on the selected grouping option.
|
| Min Used | The minimum number of licenses used in a particular time period. |
| Avg Used | The average usage (Avg Used column value) is computed differently depending on how the usage history data is grouped.
|
| Max Used | The maximum number of licenses used in a particular time period. |
| Min Borrowed | The minimum number of licenses borrowed in a particular time period. |
| Max Borrowed | The maximum number of licenses borrowed in a particular time period. |
| Total | The total number of licenses available for the feature or Unknown if there are only denials in a particular time period. |
| Hours Used | The number of hours at least one license of a particular feature was used and/or borrowed. (Note that this column is not available with Hour grouping.) |
| Denials | The number of denials that occurred for a given feature. |
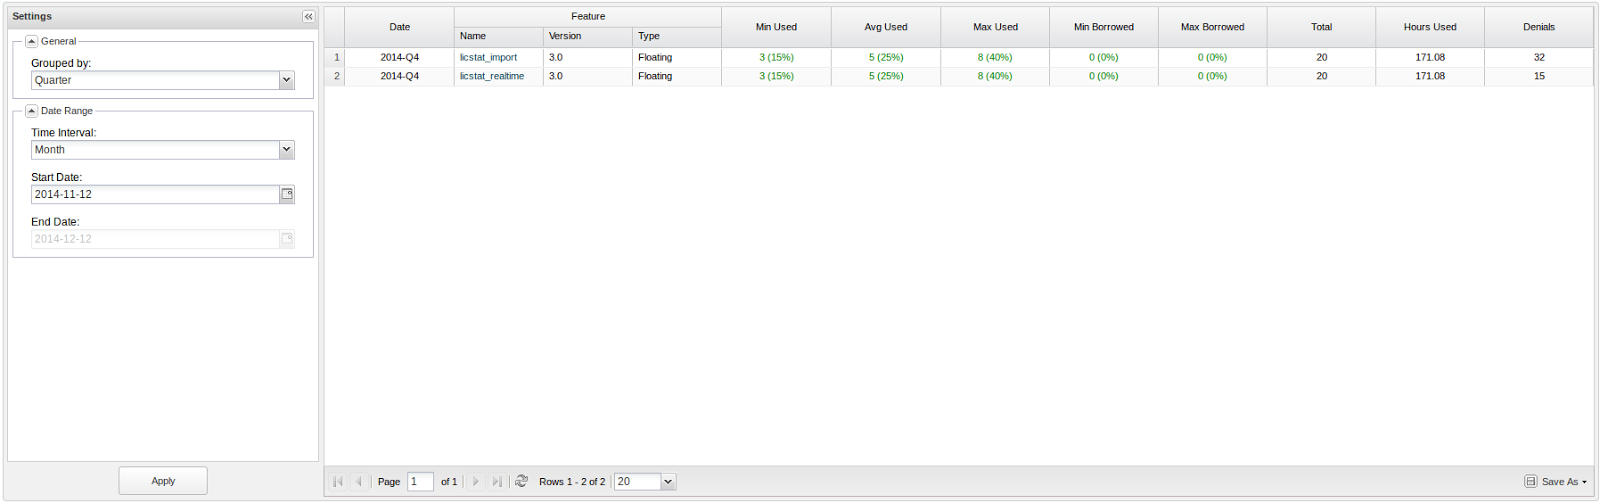
Filtering results
The Settings panel, on the left-hand side of the grid, lets you filter results.
Filtering results by date range
Under Date Range, you can choose the time interval to include in the results. The time interval can be:
- Current or Last Year
- Current or Last Quarter
- Current or Last Month
- Current or Last Week
- Today
- Yesterday
- Custom (which lets you enter a specific start and end date)
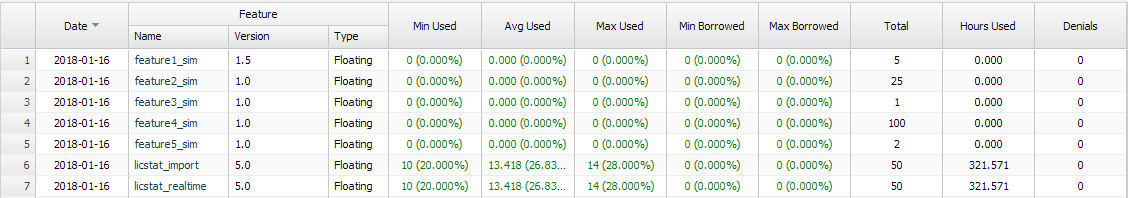
Grouping data by time period
You can group the data by hour, day, week, month, or quarter regardless of the time interval you select, because the fields aren't interrelated. For example, if you choose to group results by day for the current month, your results will look similar to the following:
Average usage calculation
The average usage (Avg Used column value) is computed differently depending on how the usage history data is grouped.
- When data is grouped by Day, the average usage is the weighted average of licenses used in particular day. For example, if you use 1 license for 8 minutes, then use 6 licenses for 2 minutes, the average usage is calculated as (1*8 + 6*2) / (2+8) = 2.
- When data is grouped by Week, the value displayed is the mathematical average of the weighted averages.