The Utilization History tab includes a list of utilization statistics and a utilization graph.
General Information
The General Information area includes identifying information for the feature, the last update time, a share code if sharing is in use (for example, "Shared on: HOST"), and the license type.
Feature Utilization grid
The Feature Utilization grid shows license usage based on how many licenses were used for how long and the percentage of utilization for those licenses.
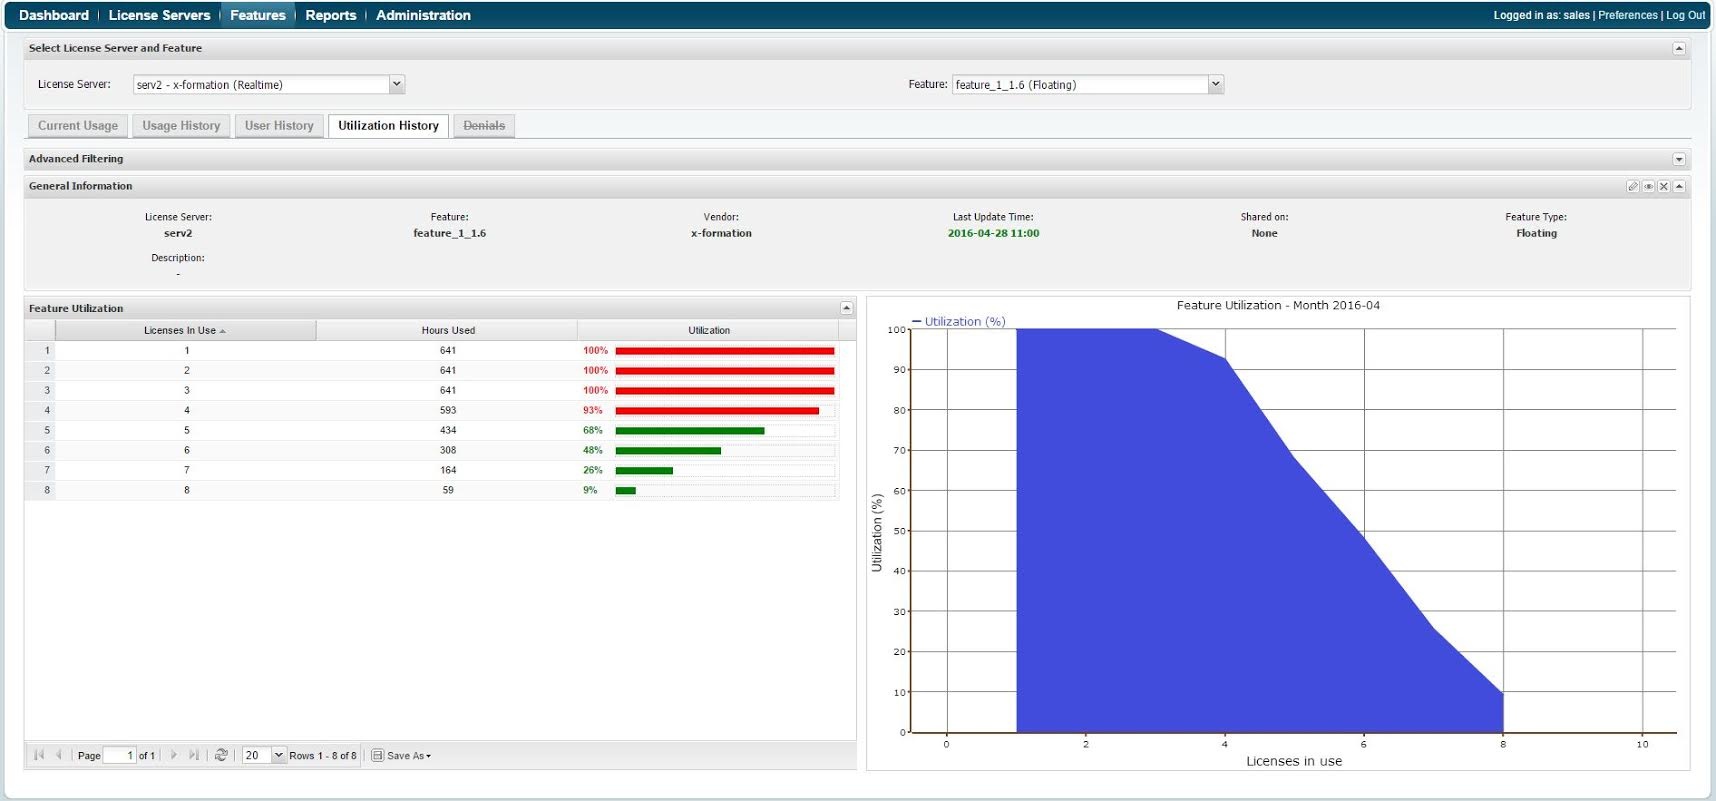
The calculation for determining the percentage of utilization is as follows:
Utilization = 100 * number of hours for which a specific number of simultaneously running licenses were used / hours monitored
For example, for 615 full hours of the reporting and 160 hours during which a specific number of licenses were used, the calculation would be:
100 * 160 / 615 = 26.0%
where
160 is the number of hours for which a specific number of simultaneously running licenses were used
The precise utilization percentage calculation may be slightly different than 26%, because the license server may be down for short times during the month (by default the Include downtime checkbox is unchecked so downtime is not shown on the utilization history graph).
Looking at the utilization details in the example above we can see that the amount of utilization drops consistently for usage of multiple licenses, with one license being used simultaneously about 100% of the time, four being used for about 93%, five for 68% and so on. Only 8 of the 10 total licenses were used at any given time.
If this trend continues, it is a good indication that the number of licenses purchased at renewal time can be reduced from 10 to 8, depending on how crucial access to the licenses is for your users' productivity.
Feature Utilization graph
The Feature Utilization graph gives you a visual picture of the license utilization trend throughout the month. You can also select to view utilization based on hours (in both the table and the graph), by selecting the From hour/To hour times you wish to view from the bottom of the graph. (For additional information about feature graphs, see Feature usage graphs.)
Filtering results
You can choose the time interval (Year, Quarter, Month or Day), date range, and time range to include in results from the Advanced Filtering area.
You can also choose whether to include downtime in the results by toggling the Include downtime checkbox. If you include downtime, the utilization (in both the chart and the grid) is based on the entire month, including times when the server was down. If you do not include downtime (the default), utilization includes only the time that License Statistics and the monitored server were up.