| The information on this page refers to License Statistics v4.19 or newer, which made the following changes and improvements to the License Server Uptime chart: added the option of choosing a date range to include in the displayed results; added Save button and the Refresh icon to enable saving and reloading the data; enabled the display of more precise information about possible license server status in the License Server Uptime chart. If you are running an older version of License Statistics, see documentation for versions prior to v4.19. |
From the License Servers page, the License Server Uptime tab shows a chart of license server status for the currently selected license server during any period the server status was monitored.
To select a different license server for which to view the status, use the License Server pick list in the Selected License Server section at the top of the page.
License Server Uptime chart
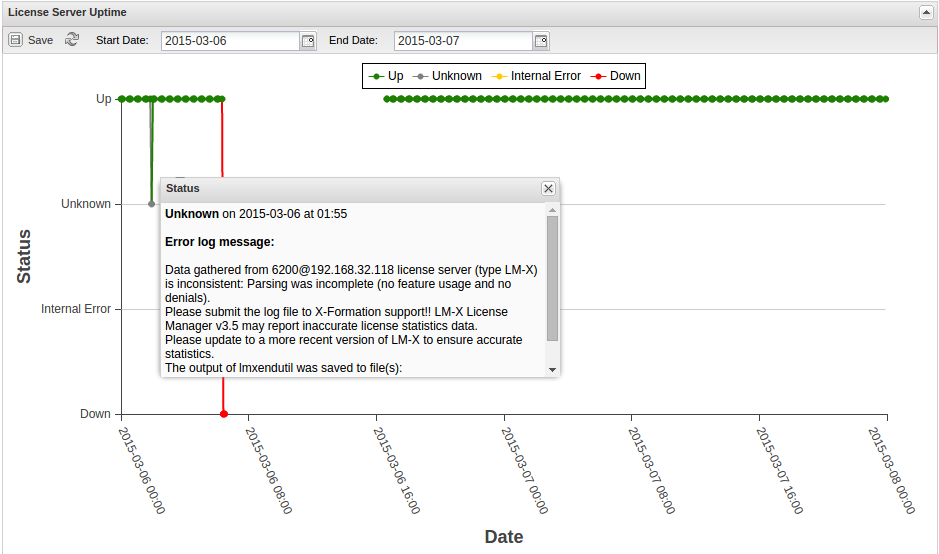
The License Server Uptime chart shows statistics about the license server status. (Note that the chart displays data for realtime servers only.)
The legend at the top of the chart defines the colors of the lines connecting data points in the chart, helping you quickly differentiate between various license server statuses. You can also use the legend to filter the results displayed by the chart. To see the results for a given license server status, click on the status for which you want to view the data.
Empty spaces or "gaps" in the chart indicate periods when License Statistics was not running and data was not being gathered.
Values displayed as dots on the chart indicate that one of the following has occurred:
- the status of the license server has changed
- an error message about the server status has been recorded in the error log
- License Statistics has been stopped
For the License Server Uptime chart, tooltips show the precise information of the time of one of the above events and optionally (if there is any), an error log message. You can see the tooltip content by hovering your mouse over the dots of the chart.
Saving and reloading data
If desired, you can save the License Server Uptime chart using Save button at the top of the chart. You can also reload the data by clicking the Refresh icon.
Date range
The date range selector at the top of the License Server Uptime chart allows you to select a date range, so you can see data for different time periods. To select a range of dates, click the desired start and end dates in Start Date and End Date fields. You can apply a maximum date range of 14 days. If you set a wider range of dates, the value on the other field will be automatically adjusted to show only a maximum number of 14 days.