The information on this page refers to License Statistics v6.22 and newer, which improved the labels in the General Information pane. If you are using a version previous to v6.22, see documentation for previous versions. |
The Usage page under the Users: Realtime section in the left navigation pane shows a graph and grid that help you understand how your users are using licenses.
Use the User/User Group pick list in the General Information area at the top of the report to select a specific user/user group to view.
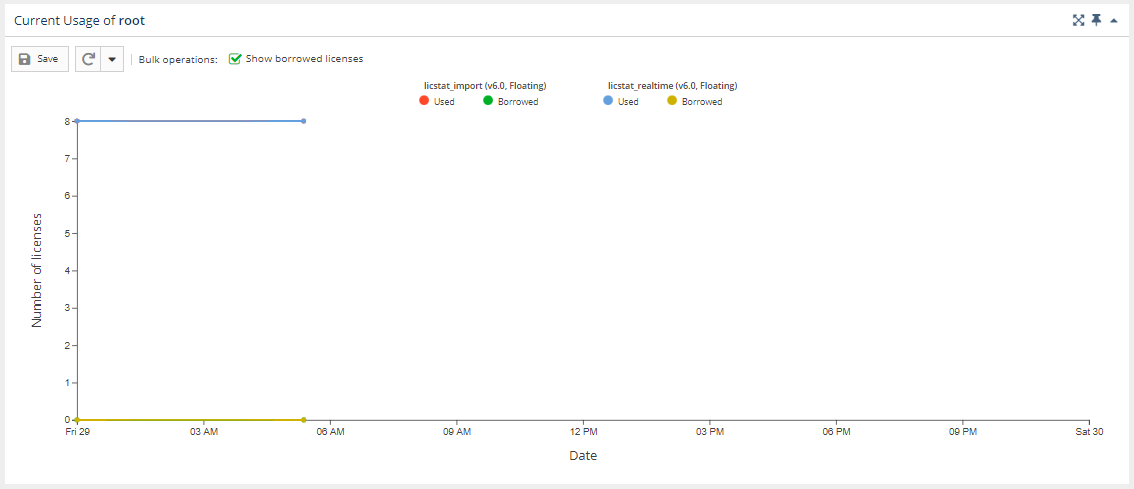
Realtime Usage graph
The Realtime Usage graph gives you a visual picture of the number of licenses used by the selected user/user group for the specified time period.
You can hide or show used and borrowed licenses. The display of these usage details in the graphs is controlled by clicking the status for which you want to view data in the legend at the top of the chart. For example, clicking the "Borrowed" option on the graph legend will remove the lines showing the number of borrowed licenses.
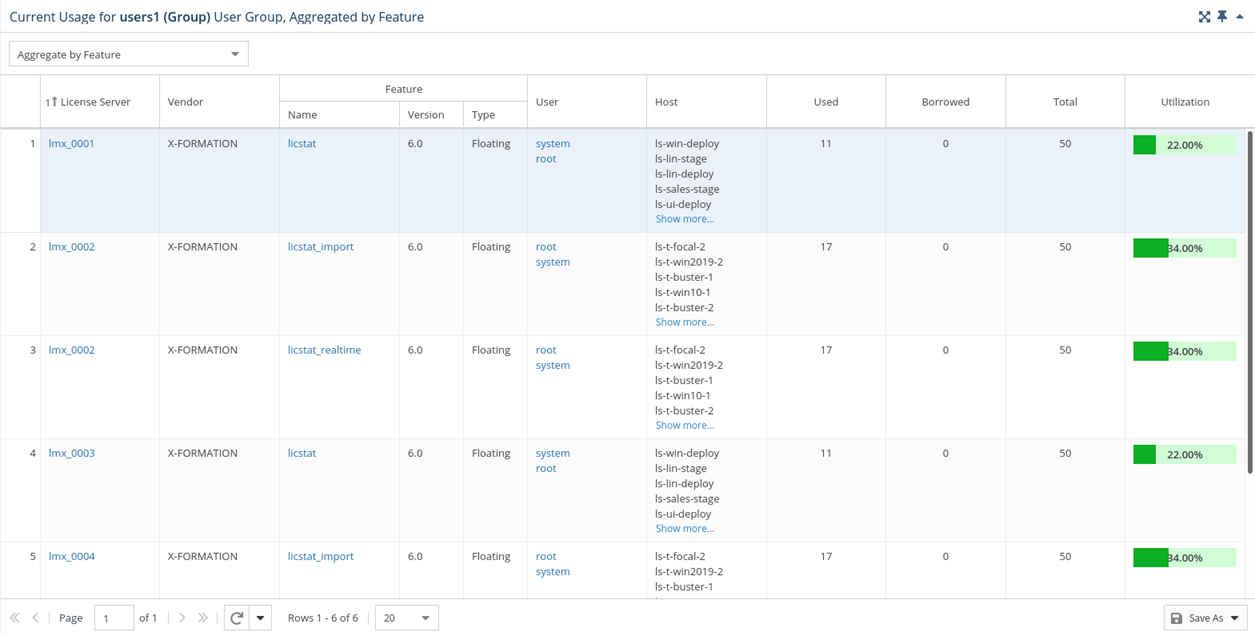
Realtime Usage grid
The Realtime Usage grid includes information about the selected user/user group's license usage, including the license server and vendor; feature information; user identification; the host that licenses were checked out from; the number of licenses used (which may be more than 1 in cases such as token licenses) and borrowed; the total number of licenses; and the percentage of utilization. If applicable, the expiration time for a borrowed license is also included in the grid.
When viewing usage for a user group, you may choose to aggregate results by Feature or by Feature and User.