| Warning |
|---|
This |
...
page refers to functionality that has been removed from License Statistics. Reports have been restructured and reorganized as of License Statistics v6 |
...
.14. The contents of the User Usage History report have been moved to Users - History - Usage. |
To see a report on usage history for a specific user/user group, select the Usage History page under the Users section in the left navigation pane. You can add the Usage History grid and graph to the License Statistics Dashboard. Learn more about customizing the Dashboard.
...
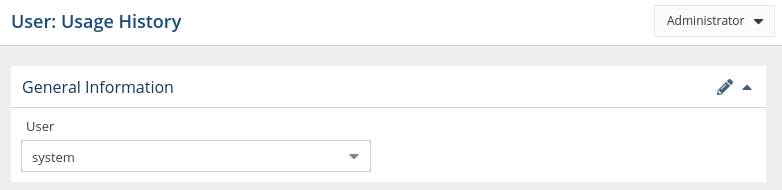
The General Information area lets you select the user/user group for which to view usage history and displays details for that user, including matching cloud users, if applicable.
Filtering results
...
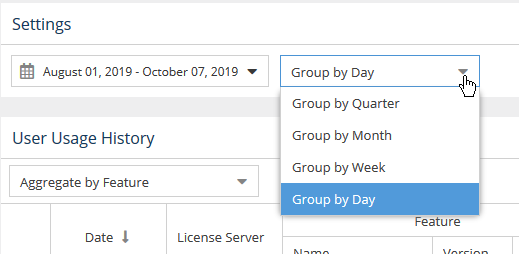
You can control how much detail is shown for usage history by setting the Group by option to:
- Quarter
- Month
- Week
- Day
User Usage History grid
...
The heat map format looks like the following example:

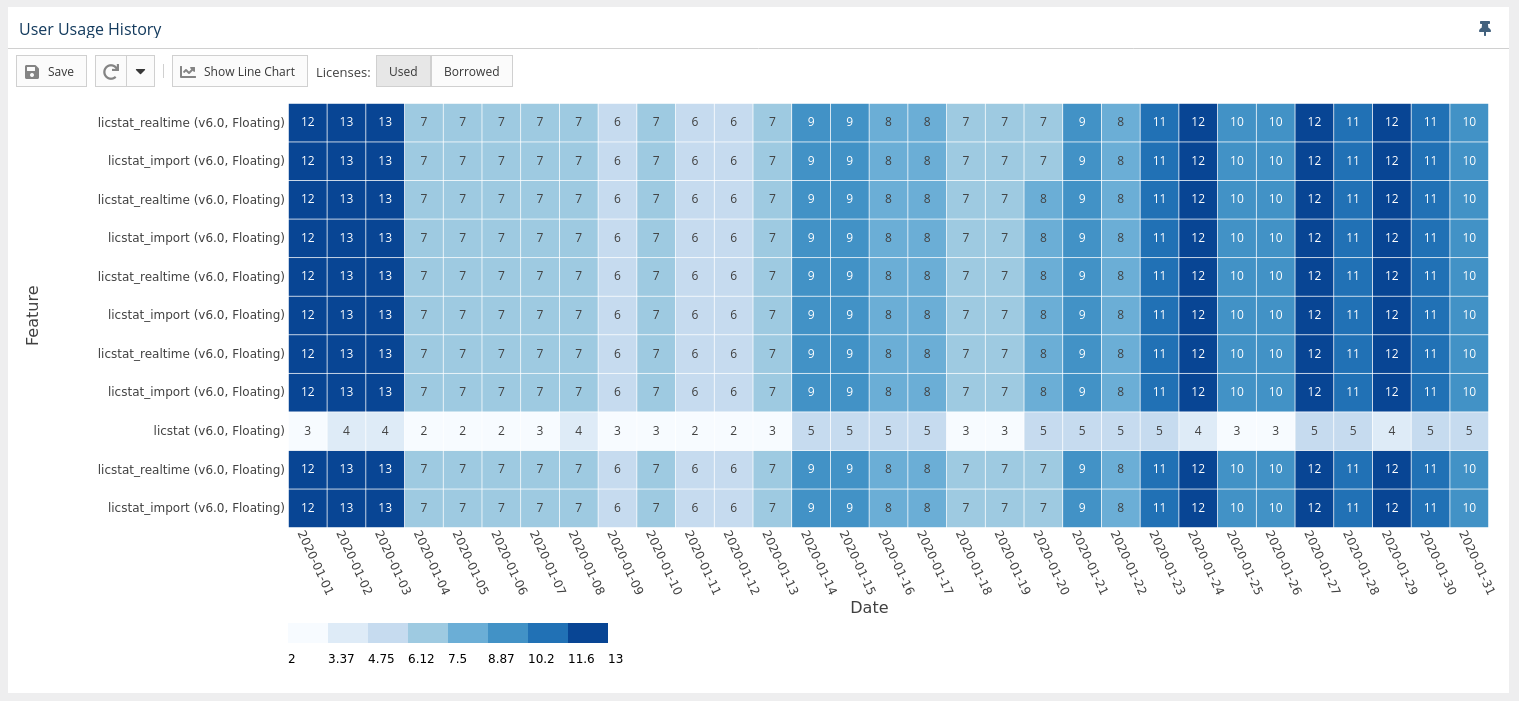
In the heat map version of the chart:
- You can toggle between used or borrowed licenses.
- The X axis reflects the grouping you selected in the Settings area at the top of the page.
- The Y axis contains list of all features that were used by the user or user group in the selected time range.
- The overlapping of the axes is the number of licenses used, with background coloring that corresponds with the scale.
- You can window an area in the chart to zoom into that area. After zooming into an area on the chart, you can return to the default zoom level using the Reset Zoom button at the top of the chart.