| Warning |
|---|
This page refers to functionality that has been removed from License Statistics. Reports have been restructured and reorganized as of License Statistics v6.14. The contents of the Utilization History report have been moved to Features - History - Utilization. |
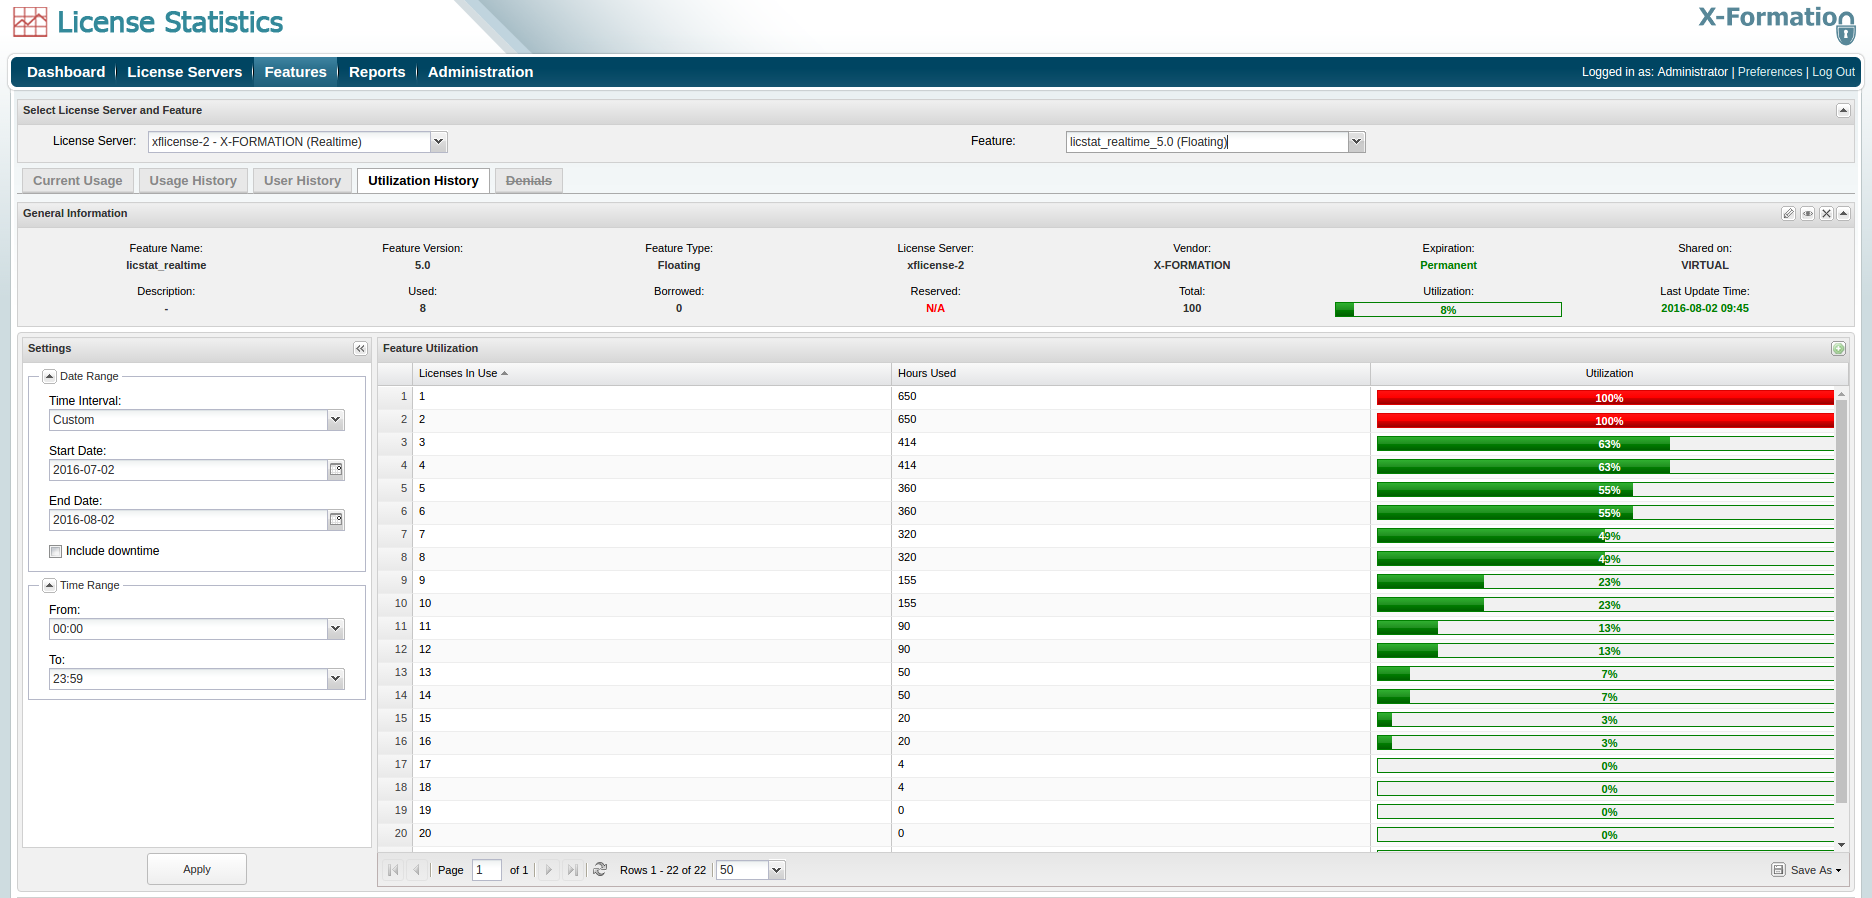
The Utilization History page under the Features section in the left navigation pane shows the percentage of license usage during any period that usage was tracked, helping you determine at which of the simultaneously used licenses the utilization drops. Identifying the number of required licenses helps avoid purchasing unnecessary licenses and creates areas for savings. The settings you make on this page (for example, filters) are retained for the next time you log into License Statistics.
The Utilization History page History tab includes a list of utilization statistics and a utilization graph.
General Information
The General Information area includes identifying information for the featureand a summary of usage information, including the last update time. You can edit the feature details by clicking the Edit icon on the right end of the General Information title bara current count of licenses used, borrowed and reserved, the total licenses available, the feature's expiration date, utilization percentage, and a share code if sharing is in use (for example, "Shared on: HOST").
Use the License Server and Feature pick lists in the in the General Information area to choose the feature for which to view statistics.
Filtering results
The Settings area lets you choose the time interval (Year, Quarter, Month, Week or Day), date, and time range to include in the results.
By default, utilization includes only the time that License Statistics and the monitored server were up. You can choose to include downtime in the results (in both the chart and the grid) by toggling the "Include downtime" checkbox.
Feature Utilization grid
The Feature Utilization grid shows license usage based on how many licenses were used for how long and the percentage of utilization for those licenses.
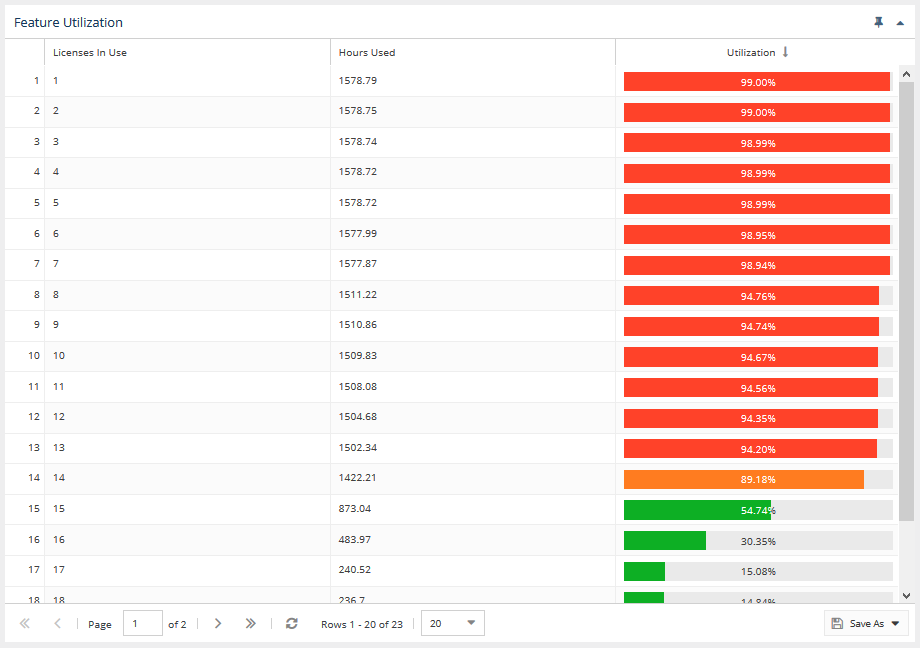
Looking at the utilization details in the example above, we can see that overall utilization is low. Of the 12 licenses, 1 was used for just over 160 hours for the month, which is approximately 27% utilization. The calculation for determining the percentage of utilization is as follows:
Utilization = 100 * number of hours for which a specific number of simultaneously running licenses were used / hours monitored
In the above For example, for 615 full hours of reporting was performed, so the calculation for our example isthe reporting and 160 hours during which a specific number of licenses were used, the calculation would be:
100 * 160 / 615 = 26.0%
where
The Note that the precise utilization percentage calculation is may be slightly lower different than 27%26%, because the license server was may be down for short times during the month (by default the Include downtime checkbox is unchecked so downtime is not shown on the utilization history graph).
We You can also see in the example that the amount of utilization drops consistently for usage of multiple licenses, with two licenses being used simultaneously only about 20% of the time, three being used for about 14%, and so on. Only 10 of the 12 total licenses were used at any given time, for less than half an hour for the entire month, and 9 licenses were used as rarely.
If this trend continues, it is a good indication that the number of licenses purchased at renewal time can be reduced from 12 to 8 or fewer, depending on how crucial access to the licenses is for your users' productivity.
add the Utilization History grid to the License Statistics Dashboard. Learn more about customizing the Dashboard.
Feature Utilization graph
The Feature Utilization graph gives you a visual picture of the license utilization trend throughout
...
a specific period of time. You can also select to view utilization based on hours (in both the table and the graph), by selecting the From hour/To hour times you wish to view from the
...
Settings panel on the left-hand side of the
...
grid. (For additional information about feature graphs, see Feature usage graphs.)
...
As shown in the example below, the amount of utilization drops consistently with the number of simultaneously used licenses.
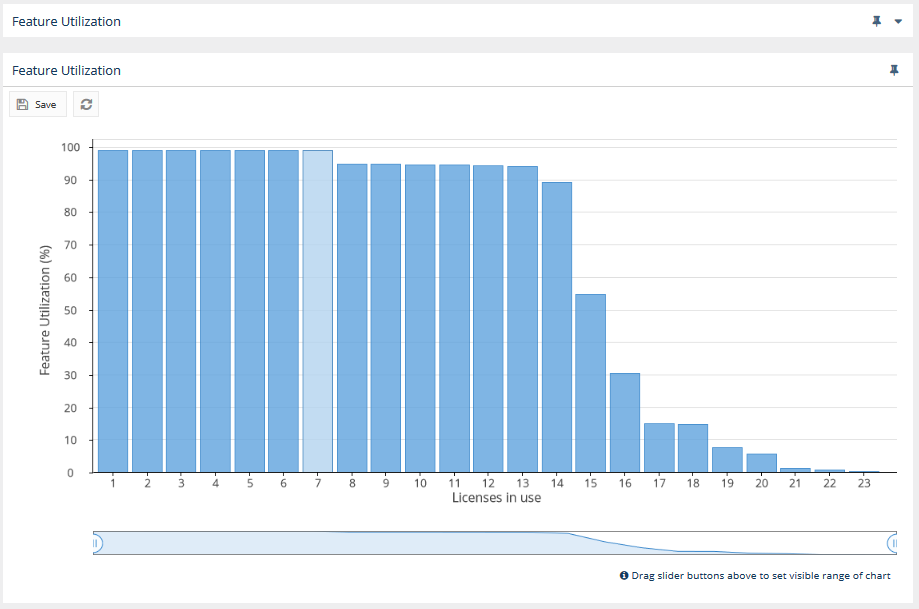
You can add the Utilization History graph to the License Statistics Dashboard. Learn more about customizing the Dashboard
Filtering results
You can choose the time interval (Year, Quarter, Month or Day), date range, and time range to include in results from the Advanced Filtering area.
...