...
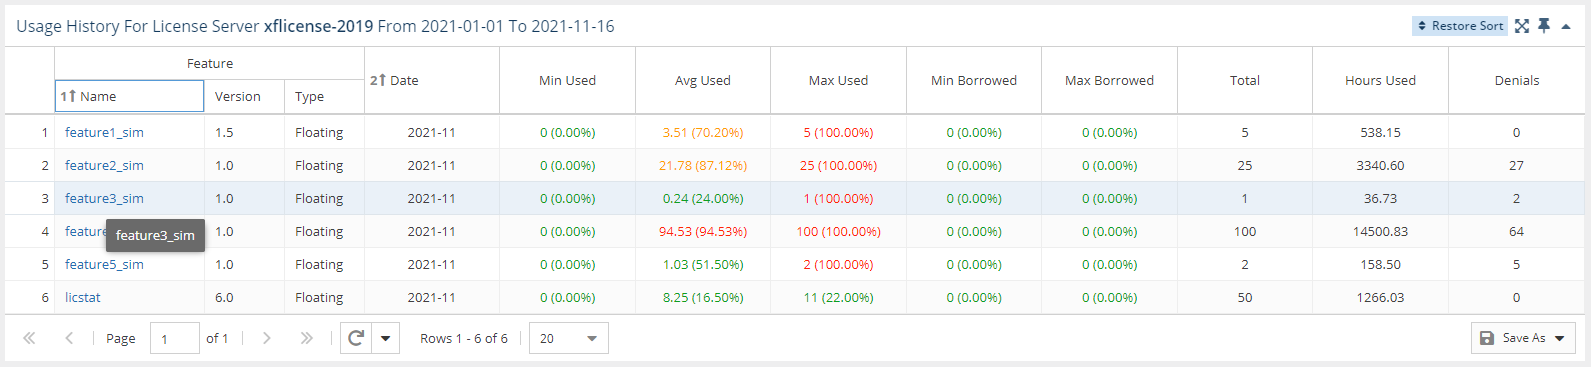
For example, when set to group information by Month, the report will limit the details to the total usage per feature for the month, as shown in the following example.
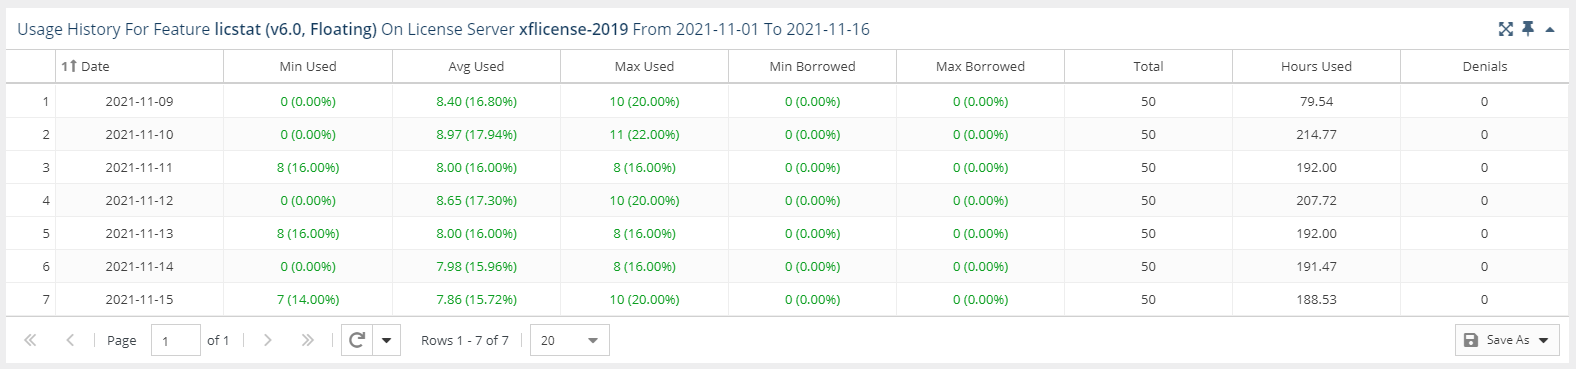
When set to group by day, details are expanded to show usage for each day in the month, as shown in the following example.
Time Interval setting
...
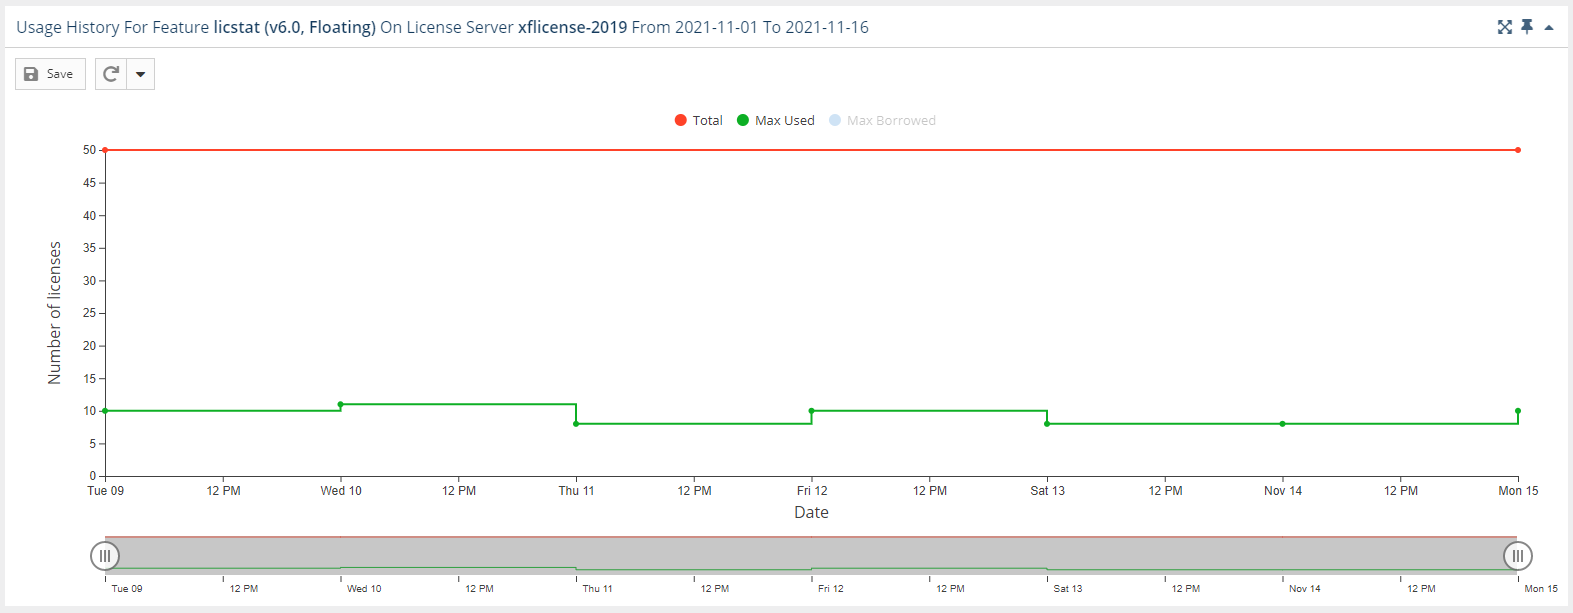
You can hide or show total, used and borrowed licenses. The display of these usage details in the graphs is controlled by clicking the status for which you want to view data in the legend at the top of the chart. For example, clicking the "Max Used" option on the graph legend will remove the lines showing the number of used licenses. The graph below shows the number of borrowed total and total used licenses, whereas the display of used borrowed licenses is hidden (greyed out).
Note: When the Feature Usage History graph is hidden, License Statistics does not have to push the high volume of data that is normally loaded into the chart. Therefore, hiding the display of this graph increases the performance of License Statistics, causing it to run faster.
See General use of feature usage graphs for additional information about feature use graphs.
...
Note that if you filter the grid data using the grid columns, those filters will also be used in the graph and when downloading the data to a file. For more information, see Introduction to using License Statistics pages and User Account preferences.
You can add the Feature Usage History grid to the License Statistics Dashboard. Learn more about customizing the Dashboard.