The information on this page refers to License Statistics v6.10 14 and newer, which redesigned the General Information area to include LDAP details (removing the separate LDAP details area) and toggle display of matching cloud users, and added a Cloud Users gridreorganized reports. If you are using a version older than 6.10, see documentation for previous versionsprevious to v6.14, see Removed Features. Also note that for a limited time, the old menu structure in the License Statistics UI will be retained, so if you cannot locate what you're looking for with the new menu structure, you can try locating it using the old structure. |
To see a report on usage history for a specific user/user group, select the Usage Historypage under the Users: History section in the left navigation pane. You can add the Usage History grid and graph to the License Statistics Dashboard. Learn more about customizing the Dashboard.
...
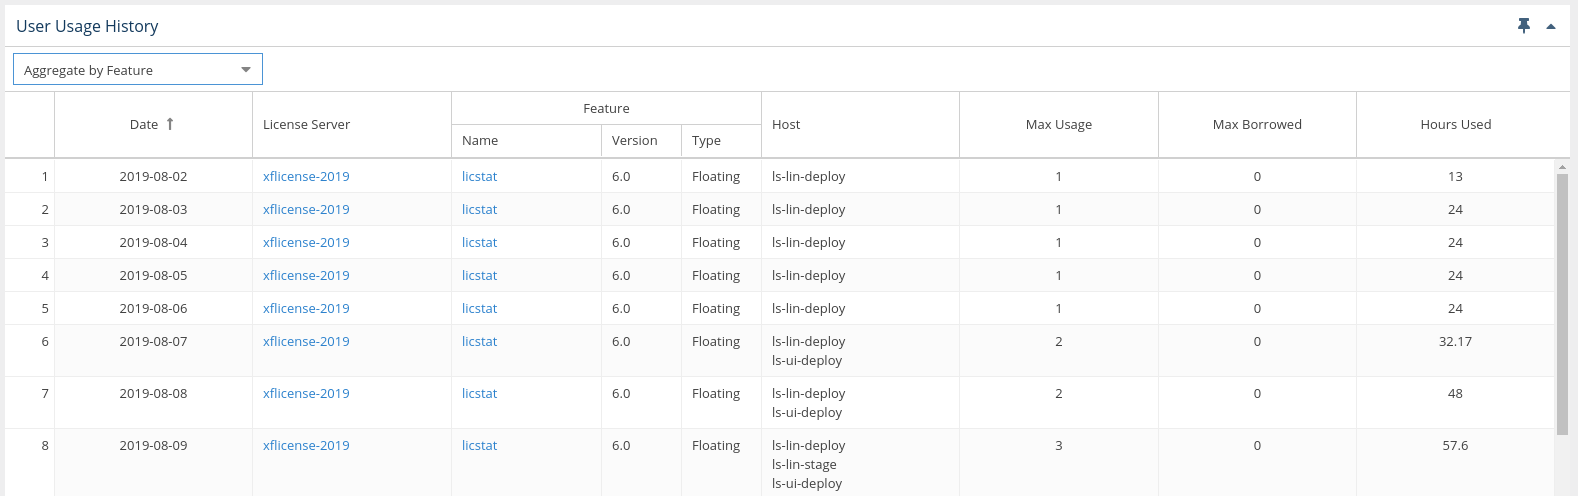
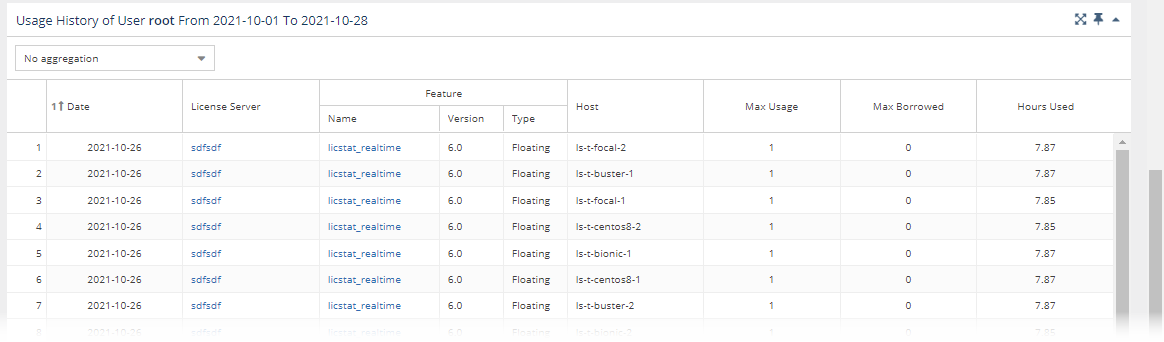
When viewing usage history for a user group, you may choose to aggregate results by Feature or by Feature and User. The default is no aggregation.
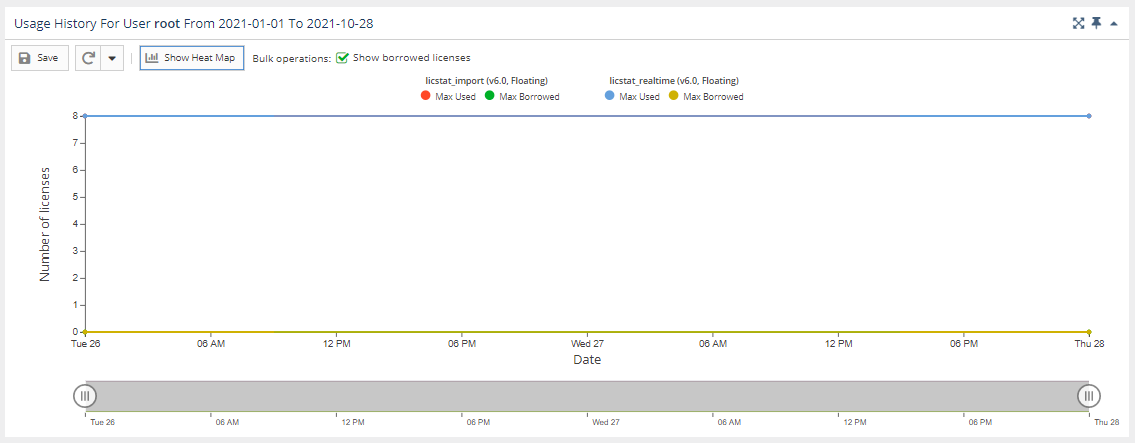
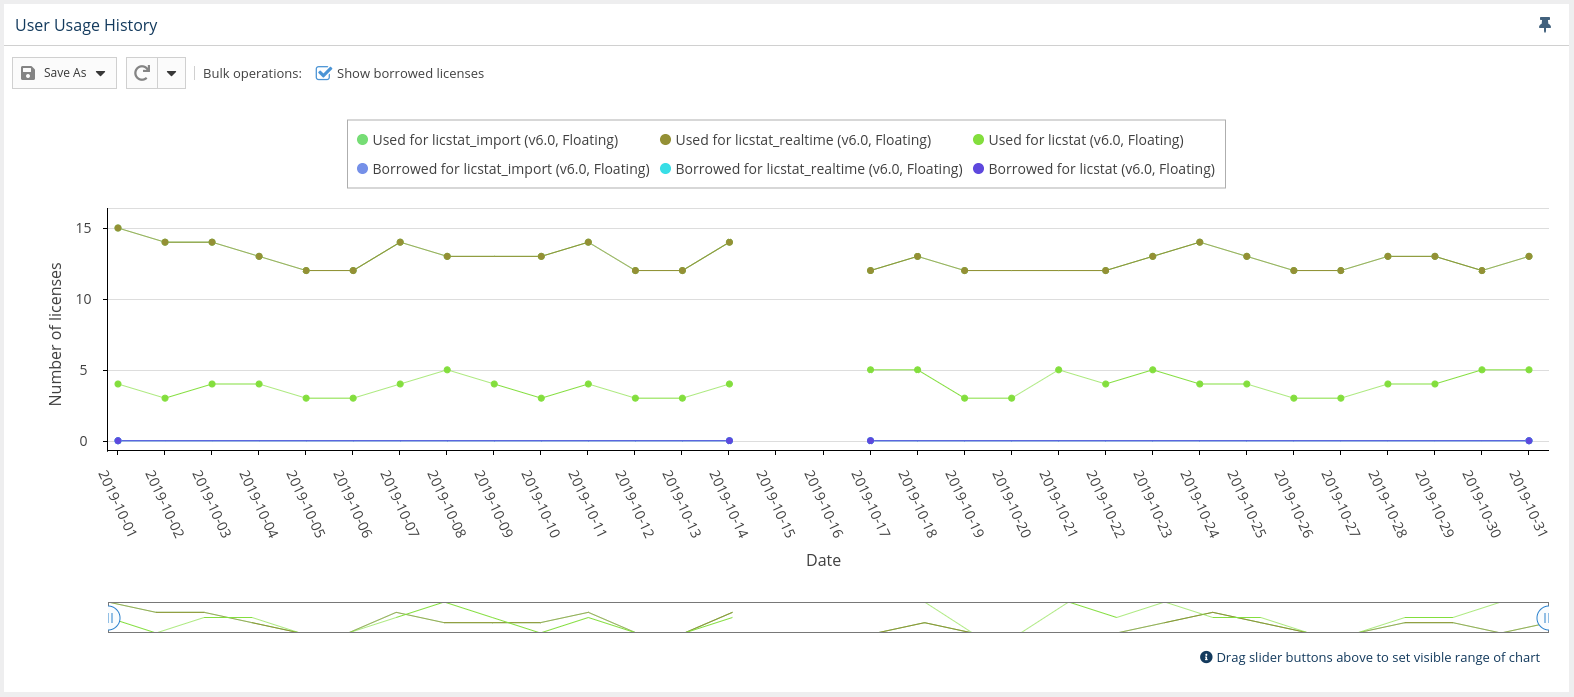
User Usage History graph
...
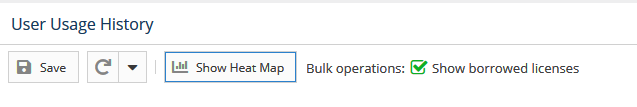
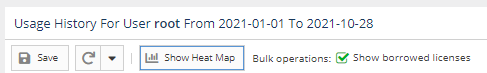
You can hide or show borrowed licenses using the "Bulk operations" checkbox above the graph. The display of usage details in the graphs can be controlled by clicking on features in the legend above the graph that you want to hide in the chart.
NEED NEW SCREENSHOT TO REPLACE THE ABOVE ILLUSTRATION TO SHOW MORE DATA AS IN THE OLD ILLUSTRATION, BELOW.
You can switch between viewing the data in the above format and viewing it as a "heat map" by clicking the "Show Heat Map" button at the top of the chart.
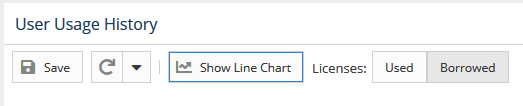
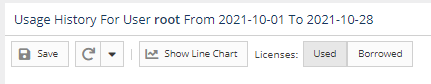
To switch the format of the chart back to a line chart, click the "Show Line Chart" button at the top of the chart.
The heat map format looks like the following example:
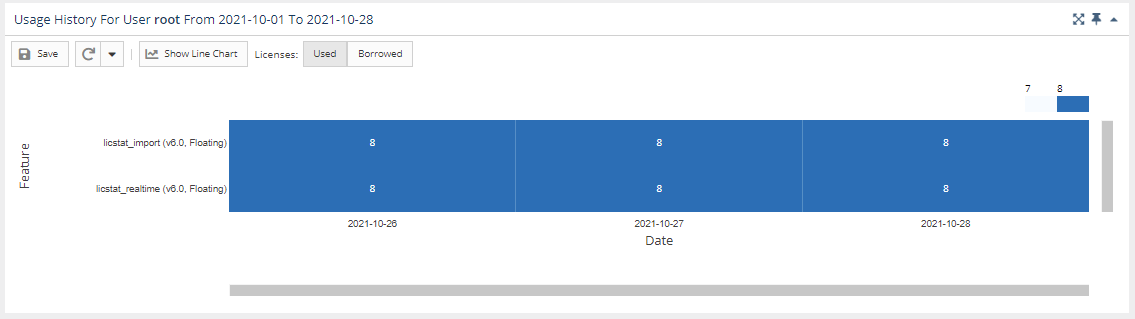
NEED NEW SCREENSHOT TO REPLACE THE ABOVE ILLUSTRATION TO SHOW MORE DATA AS IN THE OLD ILLUSTRATION, BELOW.
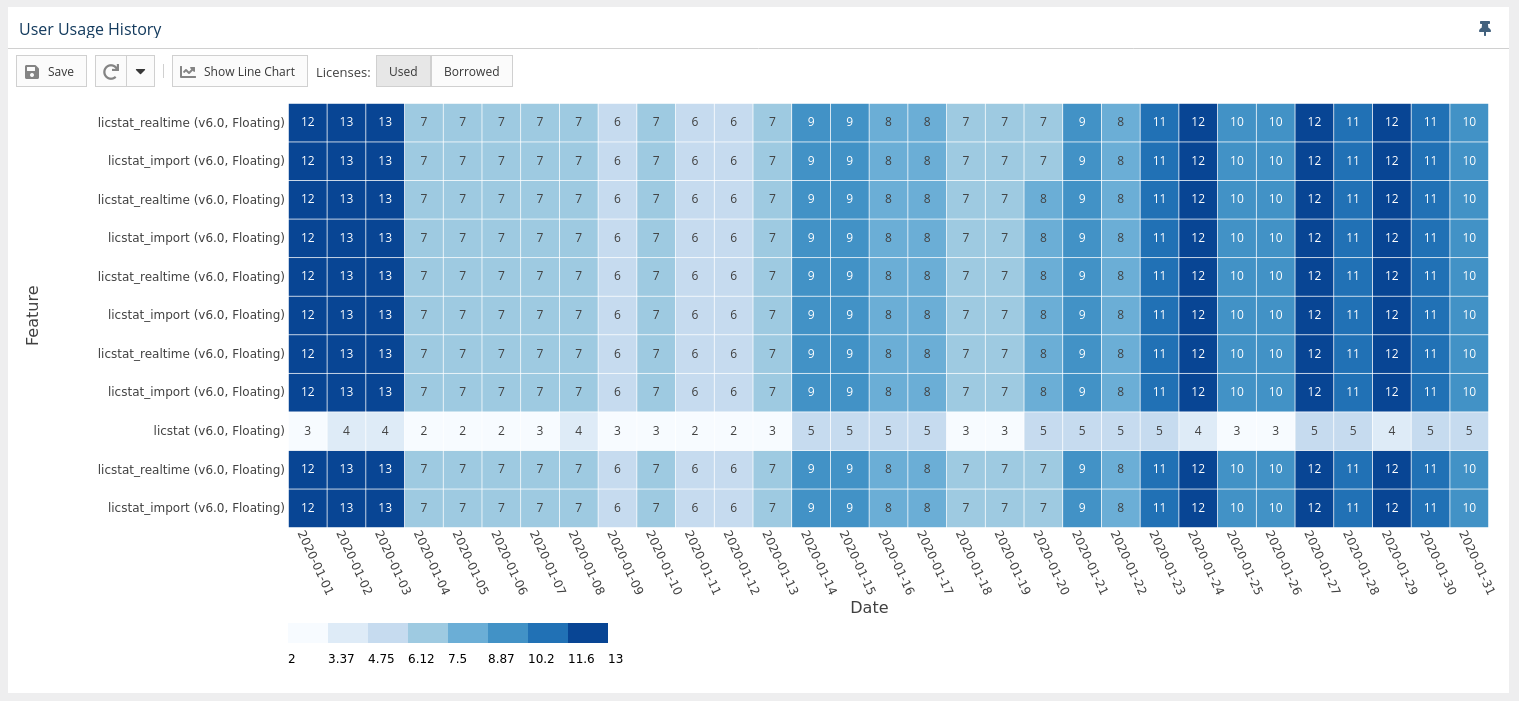
In the heat map version of the chart:
...