The information on this page refers to License Statistics v6.14 15 and newer, which reorganized reportsadded "Available" license count to the Features Realtime Usage report. If you are using a version previous to v6.14, see Removed Features. Also note that for a limited time, the old menu structure in the License Statistics UI will be retained, so if you cannot locate what you're looking for with the new menu structure, you can try locating it using the old structure15, see documentation for previous versions. |
The Usage page under the Features: History section in the left navigation pane shows statistics for license usage during any period that usage was tracked. In addition, you can see monthly percentage of use under the Utilization History tab. The settings you make on this page (for example, filters) are retained for the next time you log into License Statistics.
...
The Feature Usage History graph plots the number of licenses used, giving you a quick picture of license usage fluctuation during the selected time period. The graph reflects the advanced filters, certain grid filters, and the number of rows you select to display in the grid. For example, if you filter the Min Borrowed column to show only values greater than 1 and limit the number of rows displayed to 20, the graph results will also be limited to Min Borrowed values greater than 1 and the 20 rows of data. The data displayed on the graph is always sorted in an ascending order and the middle points are removed if the same values are repeated a few times in one series.
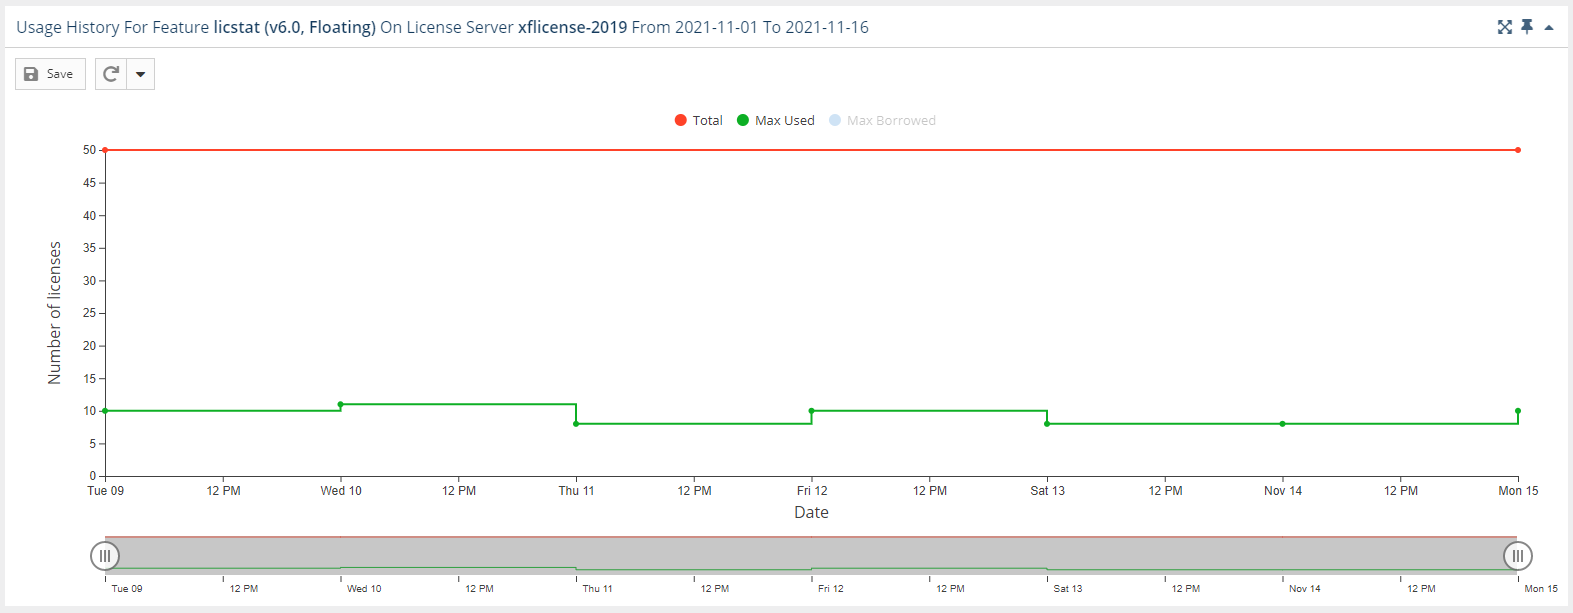
You can hide or show total, used and borrowed licenses. The display of these usage details in the graphs is controlled by clicking the status for which you want to view data the graph lines for usage details (Min/Max Used; Min/Max Borrowed; Min/Max Reserved; Min/Max Available; and Total) in the graphs by clicking the item in the legend at the top of the chart. For example, clicking the "Max Used" option on the graph legend Total" legend item will remove the lines showing the number of used licenses. The graph below red line at the top of the graph that shows the number of total and used licenses, whereas the display of borrowed licenses is hidden (greyed out). 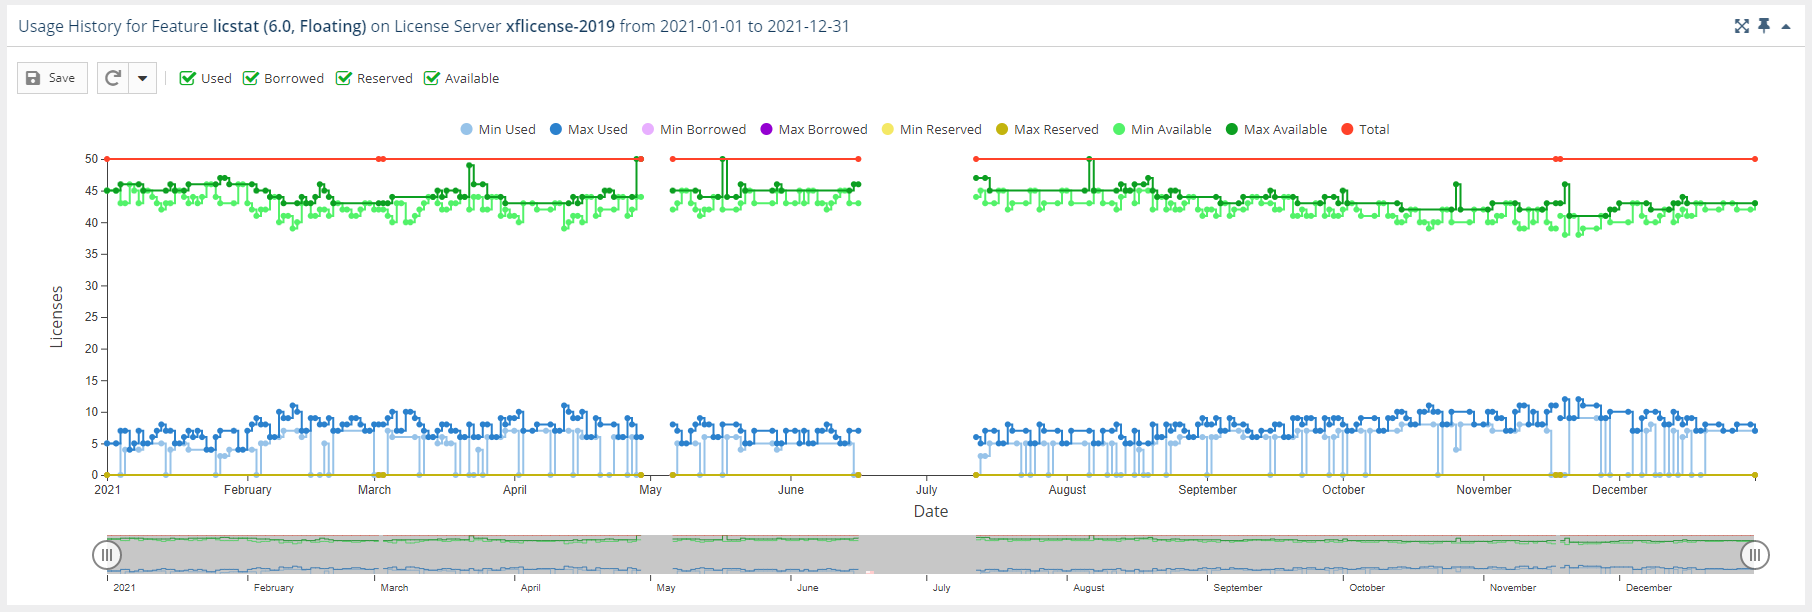
See General use of feature usage graphs for additional information about feature use graphs.
...
The Feature Usage History grid includes both the number and percentage of minimum, average, and maximum license usage; minimum and maximum borrowed licenses; minimum and maximum reserved licenses; and minimum and maximum borrowed licensesavailable licenses (total licenses minus the number of used and reserved licenses) for the selected feature. The grid also includes the total number of licenses for the selected feature, the number of hours at least one license for a particular the feature was used and/or borrowed, as well as information about denials.
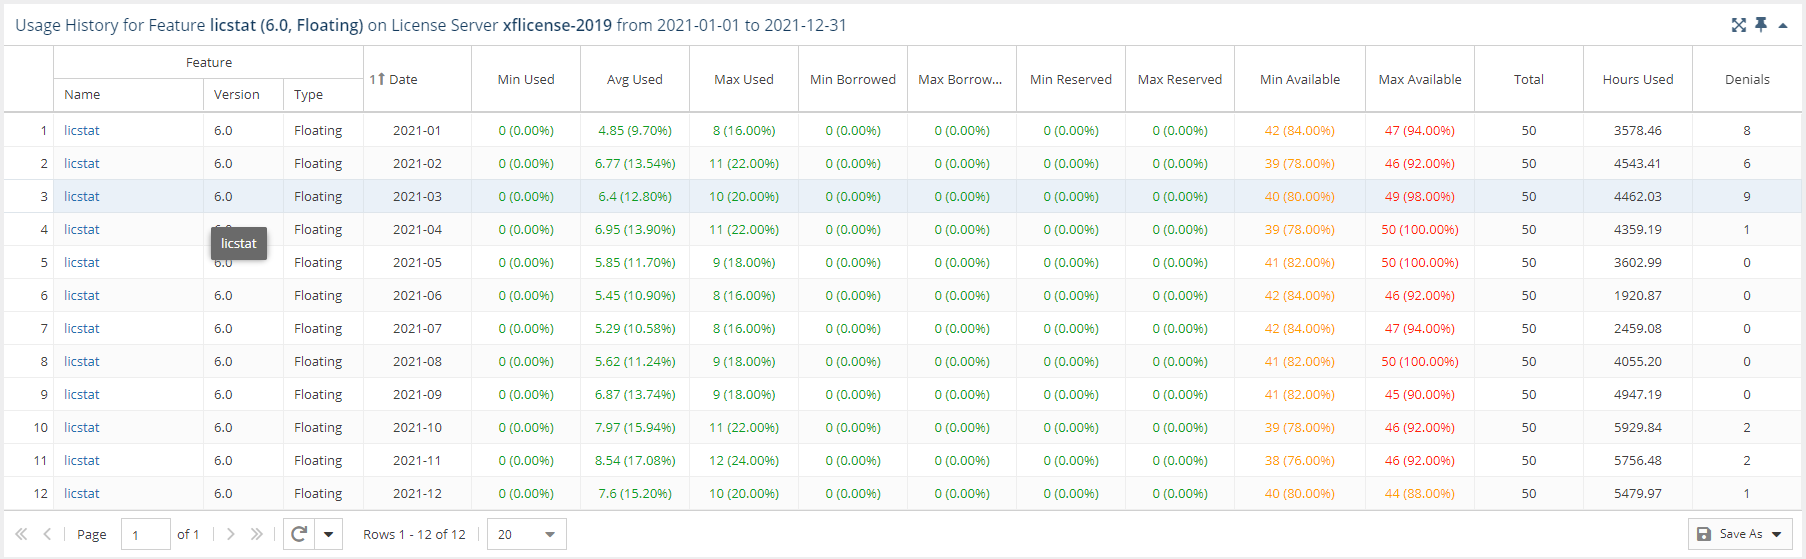
The color of the text in the license usage columns helps you quickly recognize the level of utilization:
...