The information on this page refers to License Statistics v6.6 14 and newer, which removed the Current License Usage bar chart. reorganized reports. If you are using a version previous to v6.6, see documentation for previous versions.14, see Removed Features. Also note that for a limited time, the old menu structure in the License Statistics UI will be retained, so if you cannot locate what you're looking for with the new menu structure, you can try locating it using the old structure. |
The Usage page under the Users: Realtime The Current Users page under the Reports section in the left navigation pane shows a report on currently active users and which features they are using. The report consists of a grid and bar chart that help you understand how your users are using licenses. The Current Users report grid shows the current license usage information for each user, including the Host on which the feature is checked out, details of the features used, the number of licenses in use, checkout time(s), and which license servers the features are running on.
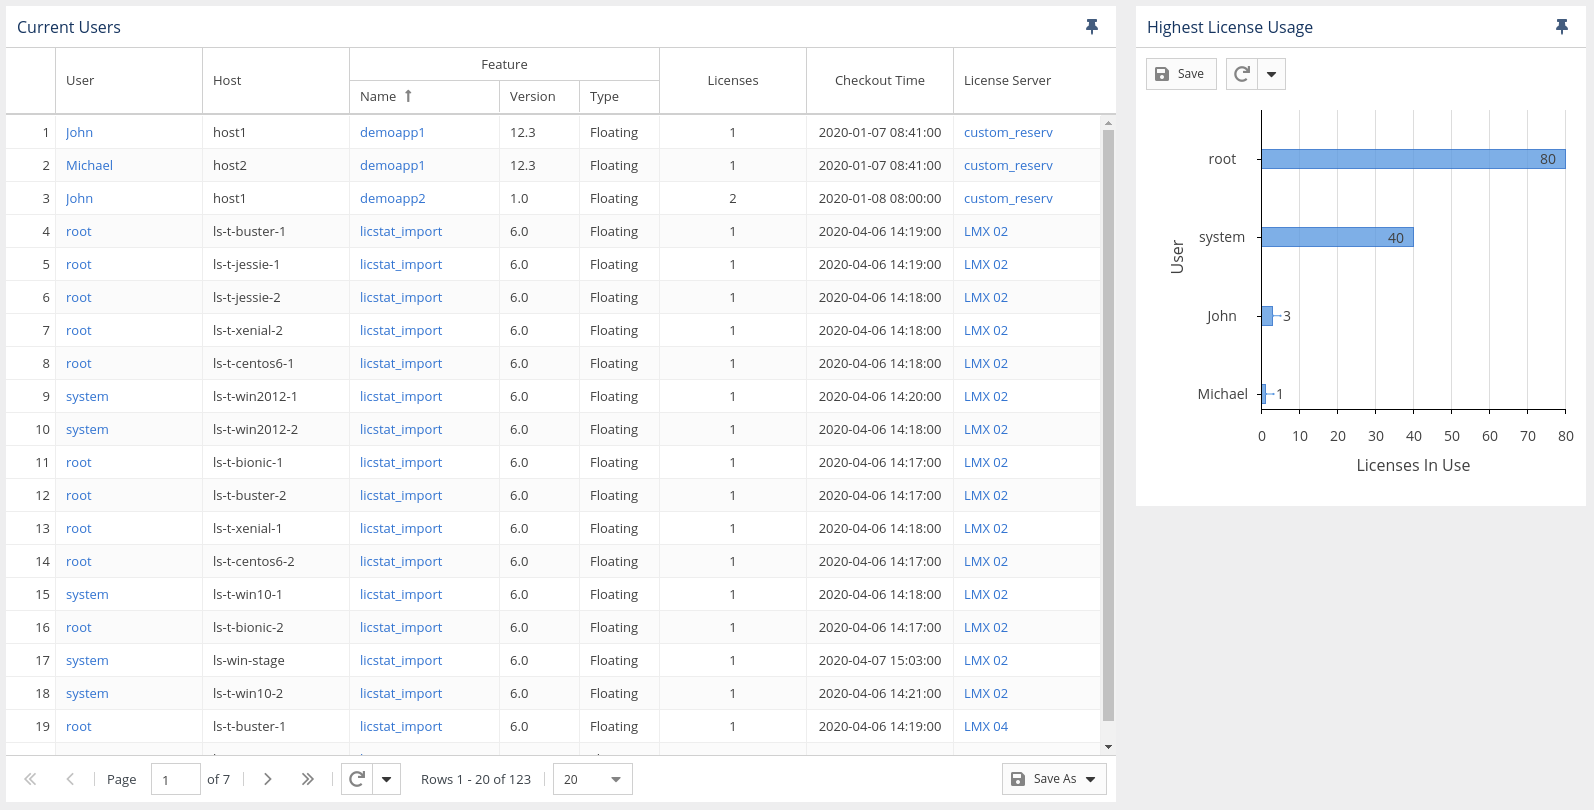
You can add the Current Users report grid and Highest License Usage bar chart (described below) to the License Statistics Dashboard. Learn more about customizing the Dashboard.
You can save the charts in the Current Users report using the Save button and reload chart data by clicking the Refresh icon, both found at the top of the charts.
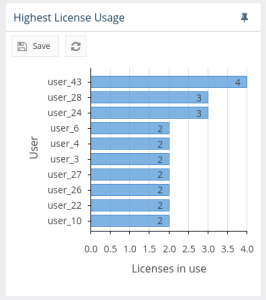
Highest License Usage bar chart
...
Example
The following example shows 10 active users that are currently using the highest number of licenses.
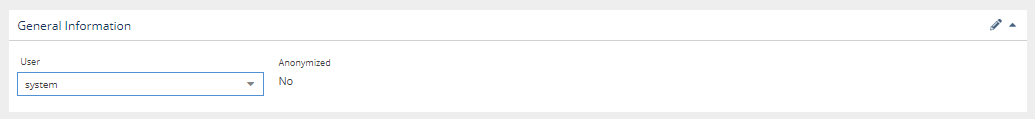
General Information
The General Information area lets you select the user/user group for which to view current usage.
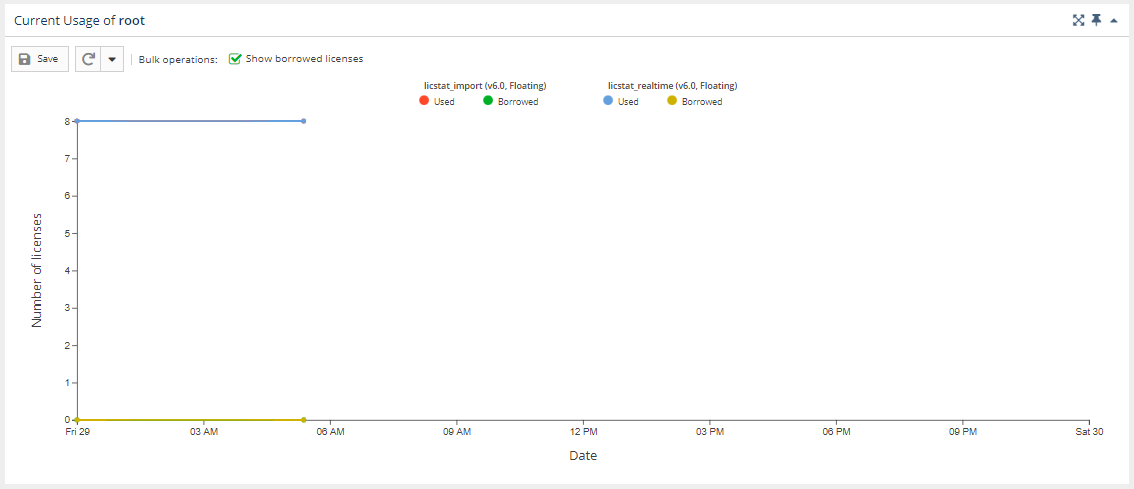
Current Usage graph
The Current Usage graph gives you a visual picture of the number of licenses used by the selected user/user group for the specified time period.
You can hide or show used and borrowed licenses. The display of these usage details in the graphs is controlled by clicking the status for which you want to view data in the legend at the top of the chart. For example, clicking the "Borrowed" option on the graph legend will remove the lines showing the number of borrowed licenses.
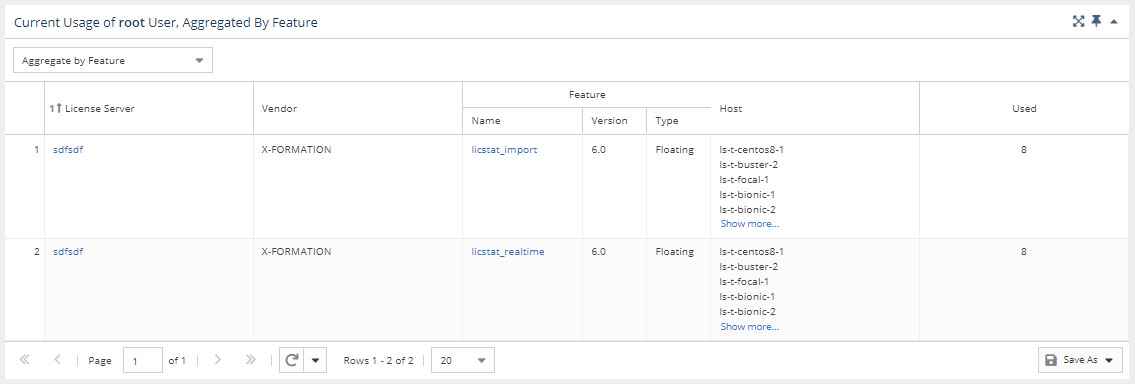
Current Usage grid
The Current Usage grid includes information about the selected user/user group's license usage, including the license server, vendor, feature information, and host (and Host IP, hidden by default) that licenses were checked out from, the number of licenses used (which may be more than 1 in cases such as token licenses), the time the license(s) were checked out and the amount of time the license was used. If applicable, the expiration time for a borrowed license is also included in the grid.
When viewing usage for a user group, you may choose to aggregate results by Feature or by Feature and User.