The information on this page refers to License Statistics v3.12, which made general improvements to the Usage History page. If you are running a previous version of License Statistics, please refer to the documentation relative to your version: For License Statistics v3.11, see v3.11 documentation. For License Statistics v3.10, see v3.10 documentation. |
From the Features page, the Usage History tab shows statistics for license usage during any period that usage was tracked. In addition, you can see monthly percentage of use under the Utilization History tab.
To choose the feature for which to view statistics, use the pick lists in the Select Features to Compare section at the top of the page. You can also select multiple features to see a comparison graph, as described below.
General Information
The General Information area includes identifying information for the feature, including the last update time. You can edit the feature details by clicking the Edit icon on the right end of the General Information title bar.
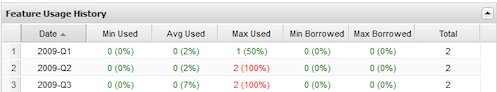
Feature Usage History grid
The Feature Usage History grid includes both the number and percentage of minimum, average, and maximum license usage and minimum and maximum borrowed licenses. The grid also includes the total number of licenses for the selected feature. Note that the highest usage is highlighted in yellow.
Feature Usage History graph
The Feature Usage History graph plots the number of licenses used per day, shown in hourly intervals, throughout the selected month. This graph gives you a quick picture of license usage fluctuation during the selected month. See Feature usage graphs for additional information about feature use graphs.
Filtering results
Using the pick lists in the Advanced Filtering area, you can choose to show results in the Feature Usage History grid by the following intervals:
- Yearly (may be grouped by quarter, month, week, day, or hour).
- Quarterly (may be grouped by month, week, day, or hour).
- Monthly (may be grouped by week, day, or hour).
- Weekly (may be grouped by day or hour)
- Daily
In addition, you can select the date range for which to view statistics from the Date range calendar.
For example, if you choose to group results by quarters in a selected year, your results will look similar to the following:
The Advanced Filtering area also lets you choose whether to show used, borrowed and total licenses on the graph. Toggling off used or borrowed licenses can be particularly helpful when comparing multiple features (described below), to limit the amount of detail shown in the graph. For more information about graphs, see Feature usage graphs.
Average usage calculation
The average usage (Avg Used column value) is computed differently depending on how the usage history data is grouped.
- When data is grouped by Day, the average usage is the weighted average of licenses used in particular day. For example, if you use 1 license for 8 minutes, then use 6 licenses for 2 minutes, the average usage is calculated as (1*8 + 6*2) / (2+8) = 2.
- When data is grouped by Week, the value displayed is the mathematical average of the weighted averages.
Comparing multiple features
You can compare up to 10 features using the Add Feature button in the Select License Server and Feature area.
To compare feature usage:
- Click Add Feature. The License server defaults to the previously selected license server.
- Select a different license server if desired.
- Select the feature to compare to the previously selected feature(s).
- Click Apply. A graph that compares the selected features is shown at the bottom of the page. (Note that the Feature Usage History grid no longer displays when comparing features.)
- Repeat the above steps to add more features to compare.
To remove a feature from the list of features to compare:
- Click Remove Feature. The last feature in the list is removed.
- To update the graph, click Apply.
- Repeat the above steps to remove as many features as desired from the comparison list.