The information on this page refers to License Statistics v4v5.17 2 or newer, which added the Hours Used and Denials columns to replaced the Advanced Filtering panel with the Settings panel; introduced more feature information in the General Information area; added the ability to add the Feature Usage History grid and added the ability to hide the display of to the Dashboard and made other enhancements to the Feature Usage History graphreport. If you are running a previous version of License Statistics, please refer to the documentation relative to your version: v4.17 documentation; v4.8 documentation; v3.12 documentation; v3.11 documentation; v3.10 documentation. |
...
To choose the feature for which to view statistics, use the License Server and Feature pick lists in the Select License Server and Feature section at the top of the page. You can select either an individual license server or a license server group from the License Servers pick list. After selecting the license server/license server group, the Feature pick list will then contain all features within that license server/license server group for you to choose from. To compare multiple usage history reports, see Usage History Comparison report.
General Information
The General Information area includes identifying information for the featureand a summary of usage information, the last update time, including a current count of licenses used, borrowed and reserved, the total licenses available, the feature's expiration date, utilization percentage, and a share code if sharing is in use (for example, "Shared on: HOST"), and the license type.
...
Filtering results
The Advanced Filtering area Settings panel lets you filter the information that displays in the Feature Usage History grid and graph by specified time intervals. Using the pick lists in the Advanced Filtering areaSettings panel, you can choose to show results in the Feature Usage History grid by the following intervals and selecting the desired dates from the Date range calendar:
- Yearly (may be grouped by quarter, month, week, day, or hour)
- Quarterly (may be grouped by month, week, day, or hour)
- Monthly (may be grouped by week, day, or hour)
- Weekly (may be grouped by day or hour)
- Daily
- Custom (lets you select the start date and end date for which to view statistic and may be grouped by quarter, month, week, day, or hour), like other interval options)
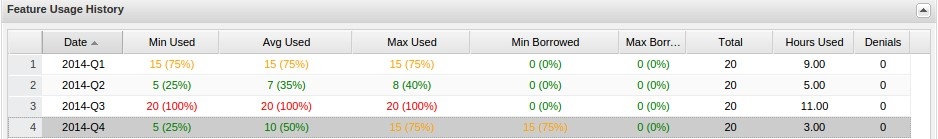
Note that you can choose to group the data by any period of time (hour, day, week, month, or quarter), regardless of the time interval you select, because the fields aren't interrelated. For example, if you choose to group results by quarters quarter in a selected year, your results will look similar to the following:
The Advanced Filtering area also lets you choose whether to show used, borrowed and total licenses on the graph. For more information about graphs, see Feature usage graphs. 
Average usage calculation
...
Note that if you filter the grid data using the grid columns, those filters will also be used in the graph and when downloading the data to a file. For more information, see Introduction to using License Statistics pages and User preferences.
You can add the Feature Usage History grid to the License Statistics Dashboard. Learn more about customizing the Dashboard.
Feature Usage History graph
The Feature Usage History graph plots the number of licenses used, giving you a quick picture of license usage fluctuation during the selected time period. The graph reflects the advanced filters, certain grid filters, and the number of rows you select to display in the grid. For example, if you filter the Min Borrowed column to show only values greater than 1 and limit the number of rows displayed to 20, the graph results will also be limited to Min Borrowed values greater than 1 and the 20 rows of data. The data displayed on the graph is always sorted in an ascending order and the middle points are removed if the same values are repeated a few times in one series.
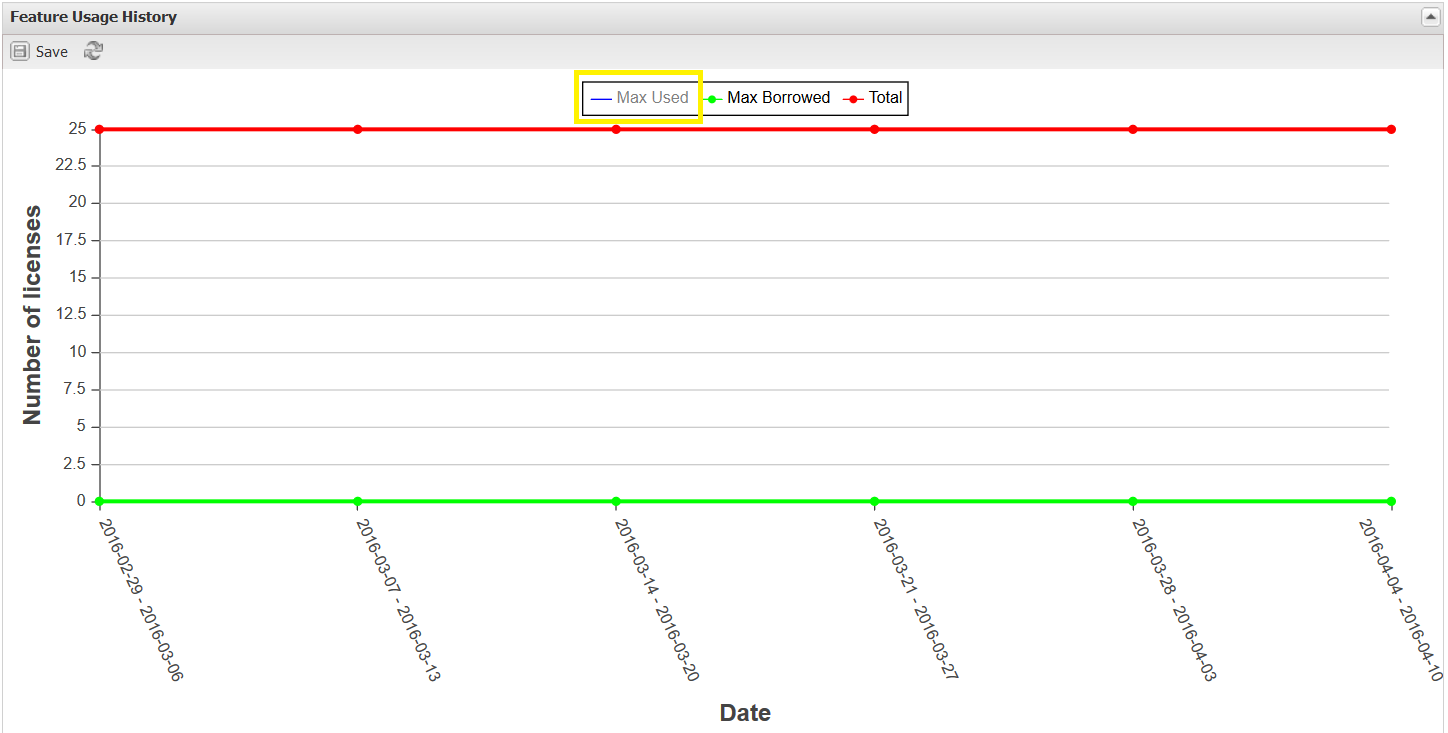
You can hide or show total, used and borrowed licenses. The display of these usage details in the graphs is controlled by clicking the status for which you want to view data in the legend at the top of the chart. For example, clicking the "Max Used" option on the graph legend will remove the lines showing the number of used licenses. The graph below shows the number of borrowed and total licenses, whereas the display of used licenses is hidden (greyed out).
Note: When the Feature Usage History graph is hidden, License Statistics does not have to push the high volume of data that is normally loaded into the chart. Therefore, hiding the display of this graph increases the performance of License Statistics, causing it to run faster.
...