...
- Navigate to the report you want to add. (See Reports you can add to the Dashboard, below, for a complete list of the reports you can add to the Dashboard).
- Make the desired settings to the report. The settings you make will be retained and visible after you add your report to the Dashboard.
- You can apply filters and select the number of rows to display in the grid.
- You can hide/show individual columns by selecting Columns and then toggling columns on/off as desired.
- You can make additional settings using the Settings panel visible in some reports. - Click
 , top right, on the title bar.
Example
The image below illustrates a customized Current Usage Above 24 Hours report which you can add to the Dashboard.
- Report settings have been customized to show license usage between 24 and 30 hours. (Note that the title of this report in the Dashboard reflects the applied settings and changes from "Current Usage Above 24 Hours" to "Current Usage Above 24 Hours and Below 30 Hours".
- Filtering has been applied to show only these license servers that include "1" in their names.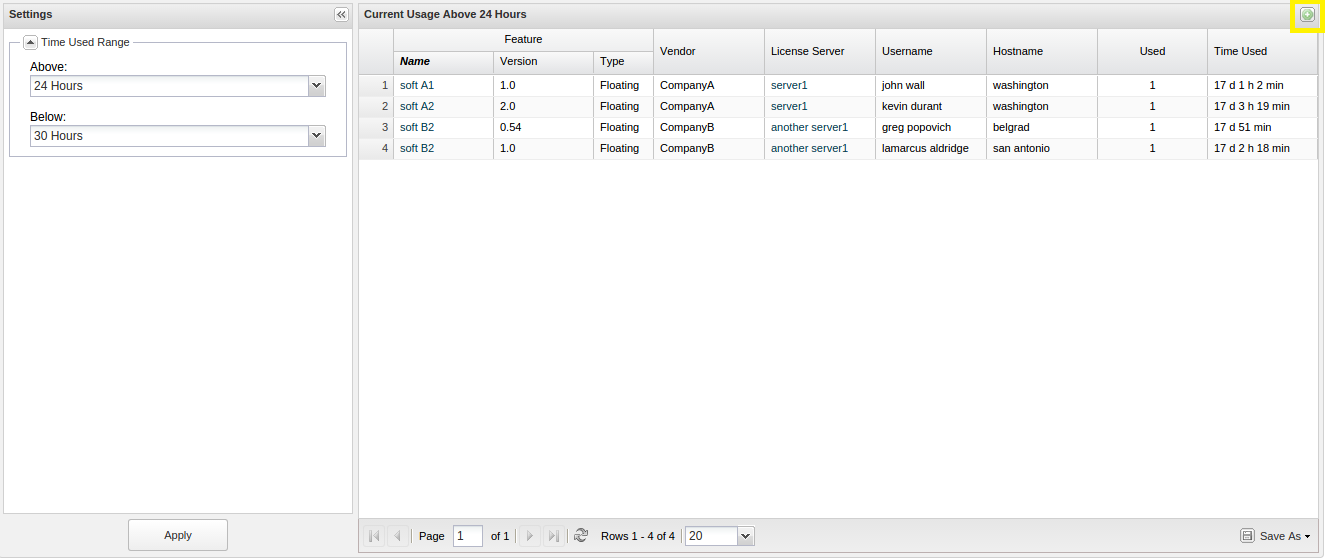
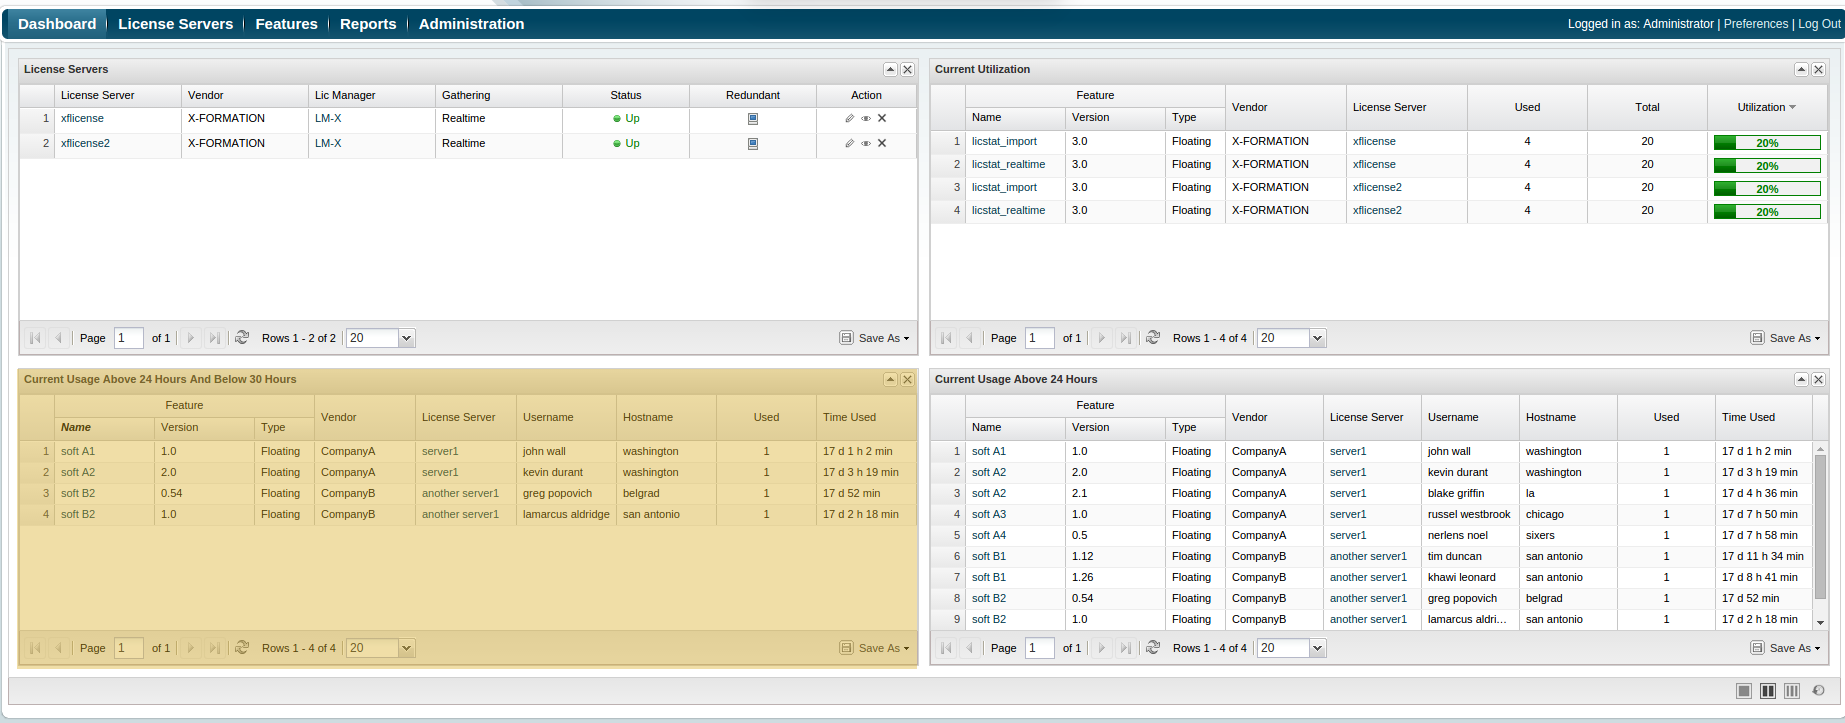
After you add your report to the Dashboard, the settings you make are retained and will be visible after you add your report to the Dashboard, as shown below.
Reports you can add to the Dashboard
The following reports can be added to the Dashboard:
- User History
- Current Users, together with the Highest License Usage and Current License Usage charts
- Current Utilization
- Expiring Features, together with the Features Expiring In Next 12 Months chart
- Current Usage Above 24 Hours
- Current Usage On Multiple Hosts