| The information on this page refers to License Statistics v5.1 or newer, which added information about grouped checkout denials. If you are using an earlier version, please refer to the documentation for releases prior to v5.1. |
...
You can add the Checkout Denials grid to the License Statistics Dashboard. Learn more about customizing the Dashboard.
Grouped Checkout Denials
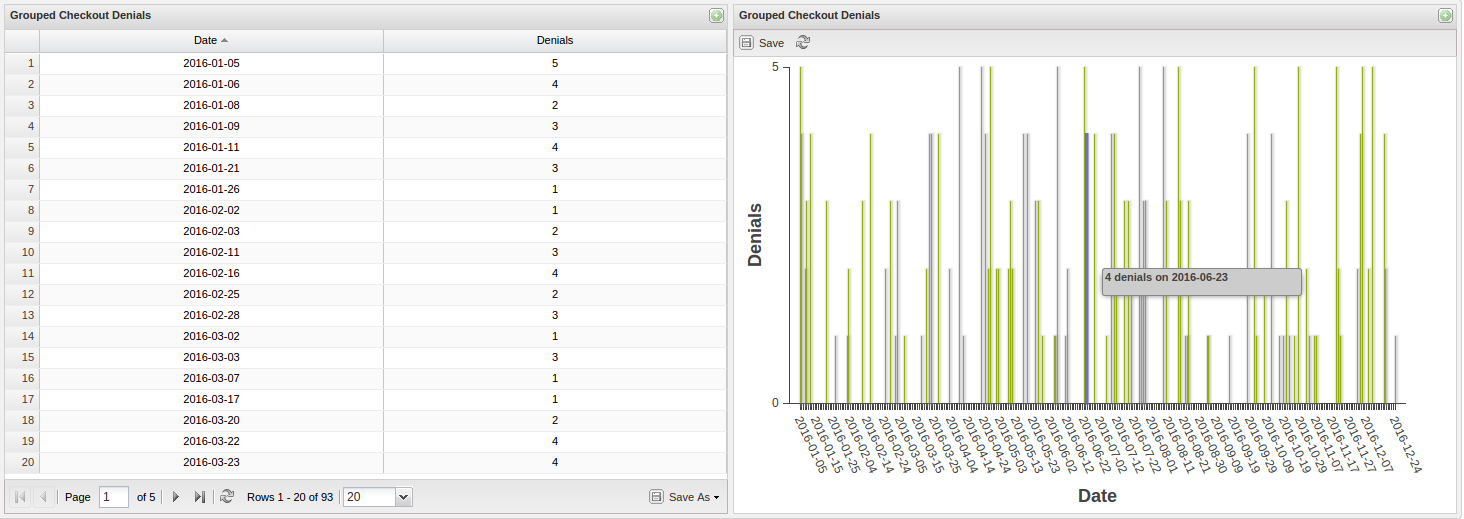
The Grouped Checkout Denials report shows periods of time (hour, day, week, month, quarter) by which denials are grouped and the number of denials that occurred in a given period of time. The data is presented in a grid format and as a chart, making it easy to quickly understand and analyze information you need.
You can adjust the settings to include only the results that are important to you by choosing grouping options, dates and time intervals for report criteria from the Settings panel as desired.
You can also add both the Grouped Checkout Denials grid and chart as well as Grouped Checkout Denials chart to the License Statistics Dashboard. Learn more about customizing the Dashboard.