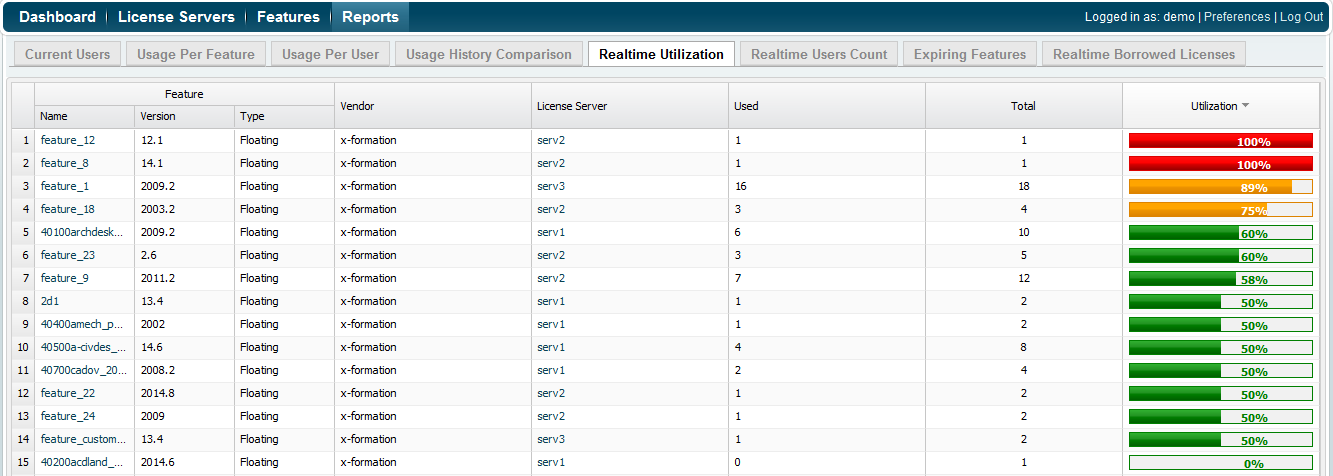
To see a report on percentage of utilization, select the Realtime Utilization tab from the Reports page.
The Realtime Utilization report shows license usage for each feature for the selected server, including the number of used licenses, the total licenses, and the percentage of license usage.You can limit the results shown on this page to utilization that is greater or less than a certain percentage using the controls at the top of the page. The default setting is to show utilization that is greater than or equal to 75%.information about the feature utilization on monitored license servers or license server groups for a particular moment. By reviewing this grid, you can quickly get a picture of which features may be overused or are nearing overuse and plan your purchasing accordingly.
Note: Because the Realtime Utilization grid shows realtime information, you may not see the same data after some time. Use the Utilization History tab for a comparison of historical data.
The captured moment is calculated using the query interval setting in seconds, times two, minus one.
Example
If your query interval is set to 2 minutes, the calculation will be:
120 seconds * 2 - 1 = 239 seconds
License usage information
The license usage information includes the following:
| Column Name | Description |
|---|---|
| Utilization | The percentage of license use for the feature. The percentage of use is calculated as Used Licenses divided by Total Licenses, times 100%. For example, if you have 5 Used Licenses and 10 Total Licenses, the Utilization is 5 / 10 * 100% = 50%. The color of the text in the Utilization column helps you quickly recognize the level of utilization:
|
| Used | The number of used licenses for the feature. |
| Total | The total number of licenses for the feature. |