...
The information on this page refers to License Statistics v6.9 10 and newer, which introduced a new Usage Calendar chart. If Session History chart (available only with new licensing model). If you are using a version previous to v6.910, see documentation for previous versions. |
...
| Scenario | User History Grid Results | Usage Per User Report Results |
|---|---|---|
| User_A checks out 4 licenses at one time using Host_1. | One row lists the User_A, Host_1 pair. The data does not include number of licenses checked out. | One row lists User_A, aggregated by Username. Includes number of licenses used at the same time (4) in the "Max Used" column. |
| User_A checks out 1 license using Host_1, returns the license 15 minutes later, then checks out the license again 5 minutes later. | Two rows list the User_A, Host_1 pair. The data does not include number of licenses checked out. | One row lists User_A, aggregated by Username. Includes number of licenses used at the same time (1) in the "Max Used" column. |
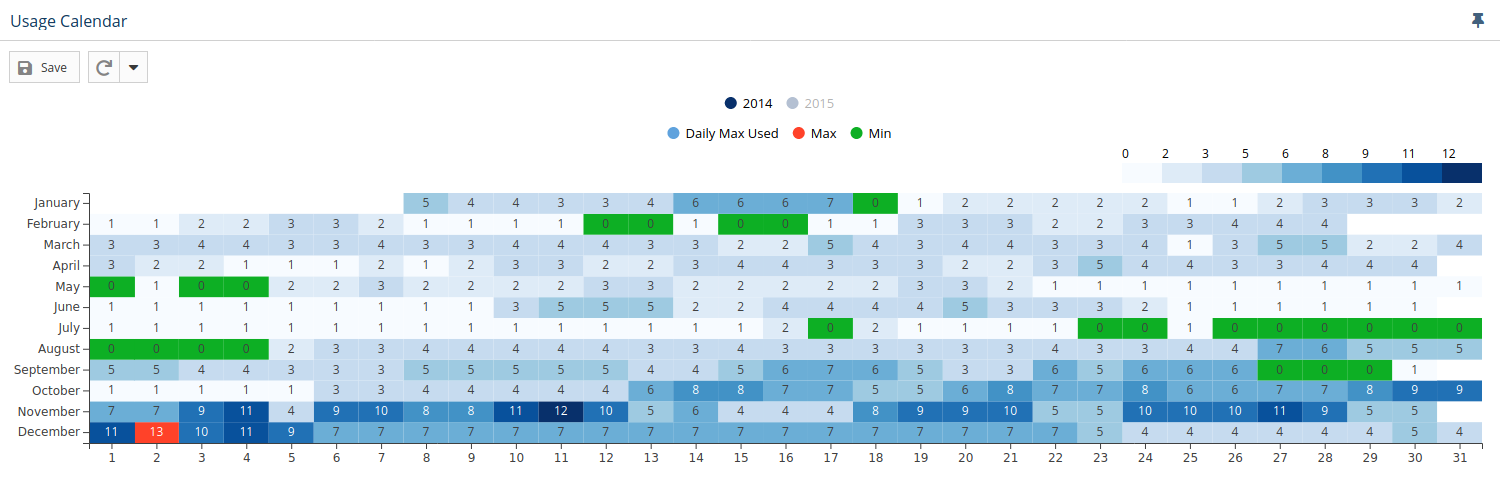
Usage CalendarCalendar
The Usage Calendar includes usage for each day in the selected range (see Filtering results, above). The Usage Calendar shows the daily maximum usage of licenses per feature. This chart includes usage for each day in the selected range. The legend at the top right of the chart shows the color coding for the number of licenses (in the illustration below, 0 to 12).
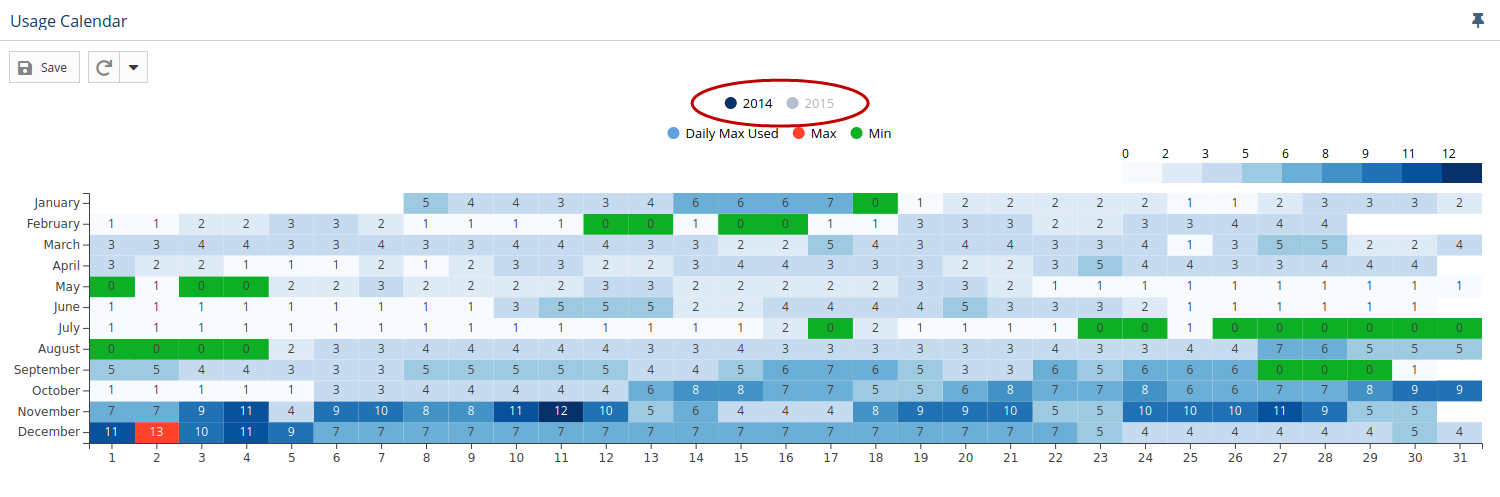
Viewing data for multiple years
If multiple years are selected for the time period, only one year is displayed at a time. To see the view data for the year you are interested in, select the year from the top of the chart.
For example, the illustration below shows data gathered for 2014 and 2015, with 2014 being displayed. At the top of the chart, "2015" is grayed out, indicating that it is not currently displayed. To display data for 2015 instead of 2014, you would click on "2015" at the top of the chart.
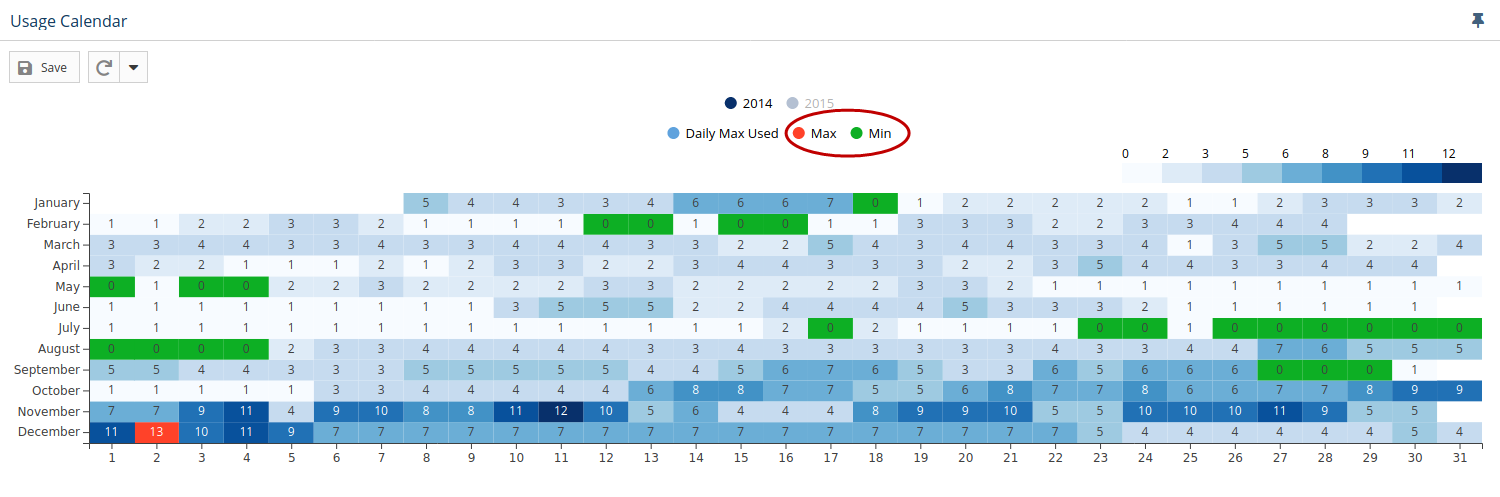
Controlling level of detail
...
For example, you may be interested in viewing only maximum usage, and in this case, can toggle off the "Min" display so the chart shows only the maximum usage. The illustration below is displaying all detail.
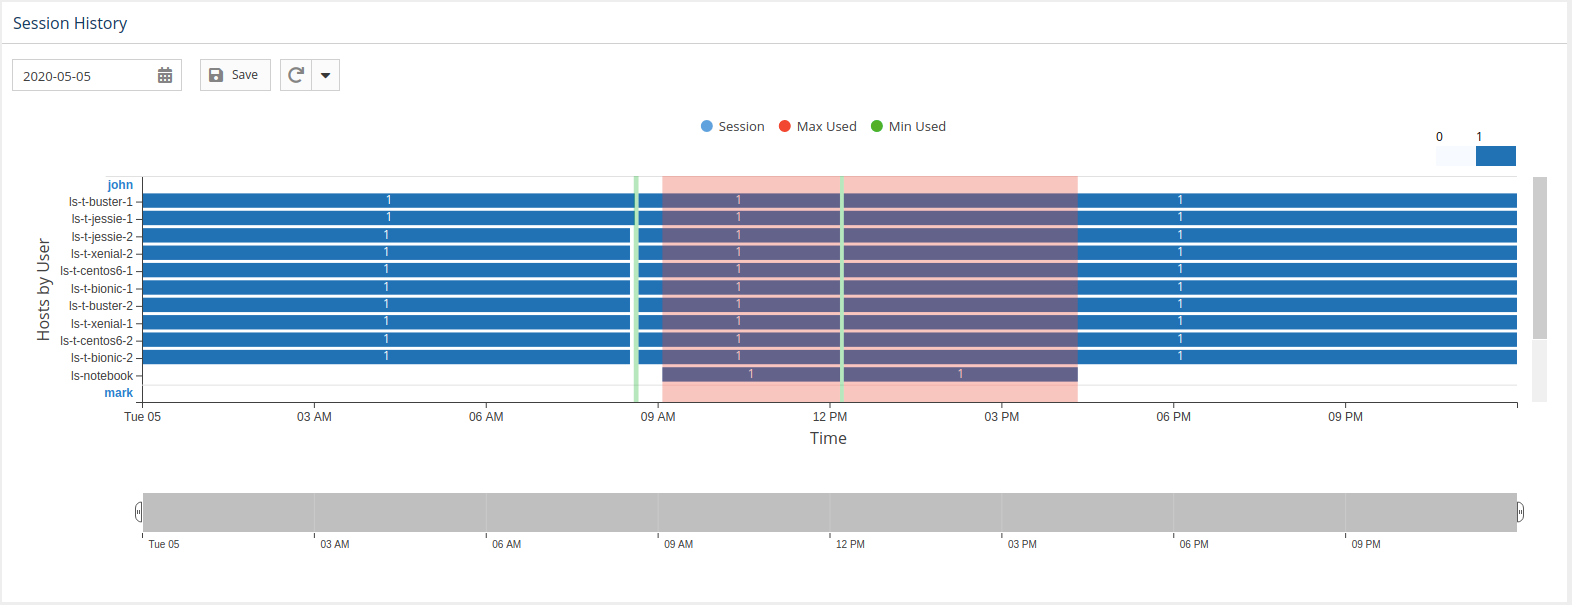
Sessions History chart
The Sessions History chart supplies fine detail for usage by showing each user session for the specified license server and feature time precision dependent on the query interval or imported log details (see Filtering results, above). You can select a particular day to view by selecting a day from the Usage Calendar chart or by using the calendar tool at the top left above the chart.
The Session History chart lets you easily see the day when the maximum usage of a particular feature occurred, the hours that usage occurred, and the users and hosts that consumed the licenses.
- The X axis is a time range (hours in 1 day).
- The Y axis is a list of users and hosts.
- You can highlight any session to see its details, including the number of licenses consumed by the user on the host and the time range for the session.
- The level of detail can be controlled using the Max and Min toggles at the top of the chart, in the same manner as described above for the Usage Calendar.
- You can select the max/min fields to see details including the sum of licenses consumed at peak of usage and the time range for the usage.
- As for the Usage Calendar, the legend at the top right of the chart shows the color coding for the number of licenses (in the illustration below, 0 to 1).