| Warning |
|---|
This |
...
page refers to functionality that has been removed from License Statistics |
...
. Reports have been restructured and reorganized as of License Statistics v6.14. The contents of the Current Users report have been moved to Features - Realtime - Sessions. |
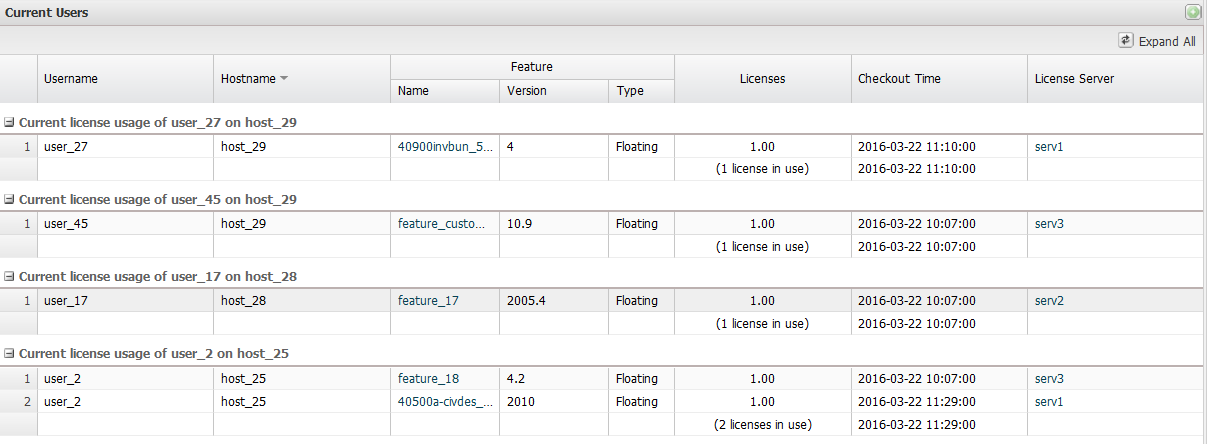
The Current Users page under the Reports section in the left navigation pane shows
...
To see a report on currently active users and which features they are using, select the Current Users tab from the Reports page.
The report consists of a grid and bar chart that help you understand how your users are using licenses. The Current Users report grid shows the current license usage information for each user, including the hostname of the machine Host on which the feature is checked out, details of the features used, the number of licenses in use, checkout time(s), and which license servers the features are running on.
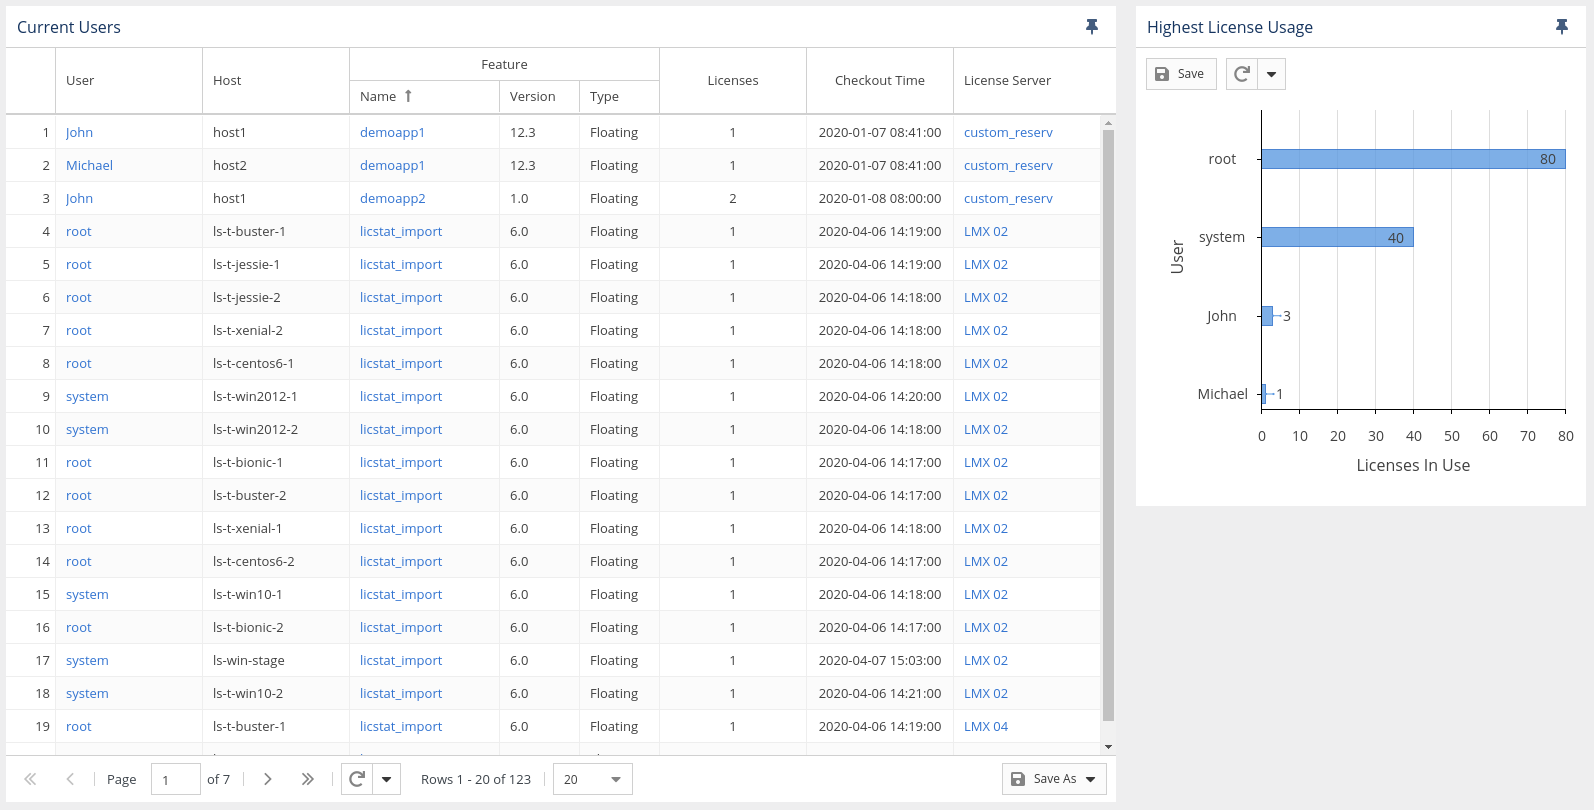
You can add the Current Users report grid and Highest License Usage bar chart (described below) to the License Statistics Dashboard. Learn more about customizing the Dashboard.
Current License Usage pie chart
The Current License Usage pie chart shows the percentage of users who are currently using at least one license, and the percentage of users who are not using any license at all based on the total number of licenses they used within the past 14 days. If desired, you can save You can save the charts in the Current Users report using the Save button at the top of the chart. You can also reload the and reload chart data by clicking the Refresh icon.
Example
The following example shows that 82 percent of the total number of users are currently using at least one license, and the remaining 18 percent are not using any license at all.
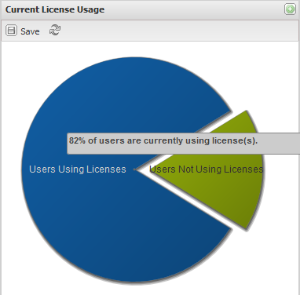
Note: Due to the licensing model of the software, the user count includes only users (usernames or user hosts, as determined by license type) who used a license within the past 14 days.
You can add this chart to the Dashboard.
, both found at the top of the charts.
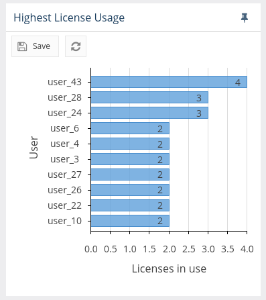
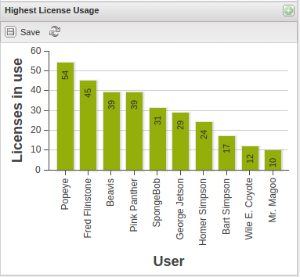
Highest License Usage bar chart
The Highest License Usage bar chart shows no more than 10 currently active users that are using the highest number of licenses. If desired, you can save the report using Save button at the top of the chart. You can also reload the data by clicking the Refresh icon.
Example
The following example shows 10 active users that are currently using the highest number of licenses.
You can add this chart to the Dashboard.
Grouping current license usage information
The Current Users report lets you group information by user on host to view:
- the number of used features
- the last checkout time
Example
The following example shows the current usage values for 3 users on host. As we can see, there are 2 users who are currently using at least one license, and User 1 is using licenses on 2 hosts. Therefore, the values are grouped into three areas, each of which displays all features used on a particular host by a user, a well as information about the number of licenses of each feature and last checkout time.
Information about the number of used features, used licenses, and the most recent checkout time is detailed below each area.