| Warning |
|---|
This page refers to functionality that has been removed from License Statistics. Reports have been restructured and reorganized as of License Statistics v6.14. See General use of feature usage graphs. |
The graphs in the Features pages give you a visual picture of your license utilization. Points on the graphs indicate the number of licenses used during the indicated time period.
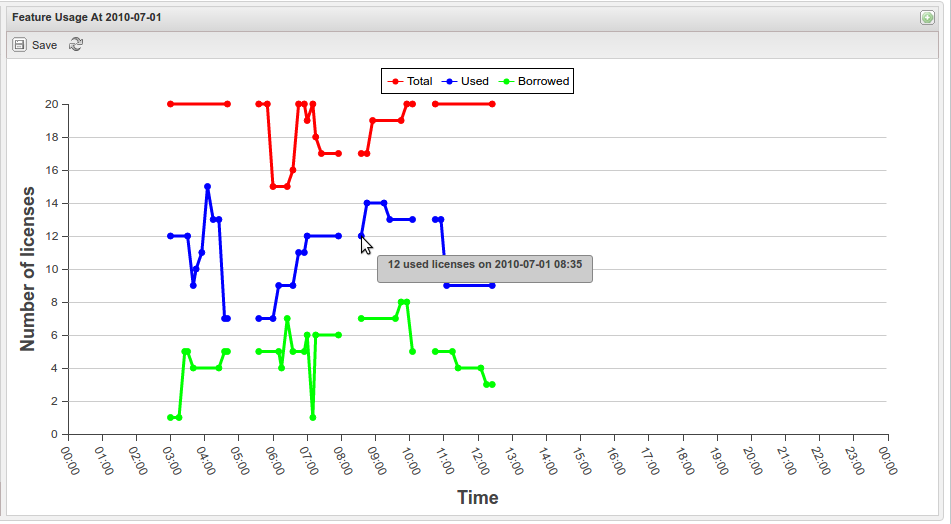
Viewing number of licenses
For Current Usage and Feature Usage History graphs, tooltips show the precise number of available, used, and borrowed licenses, as well as the time of usage at any point in the graph. The example below shows the Feature Usage graph from the Current Usage report.
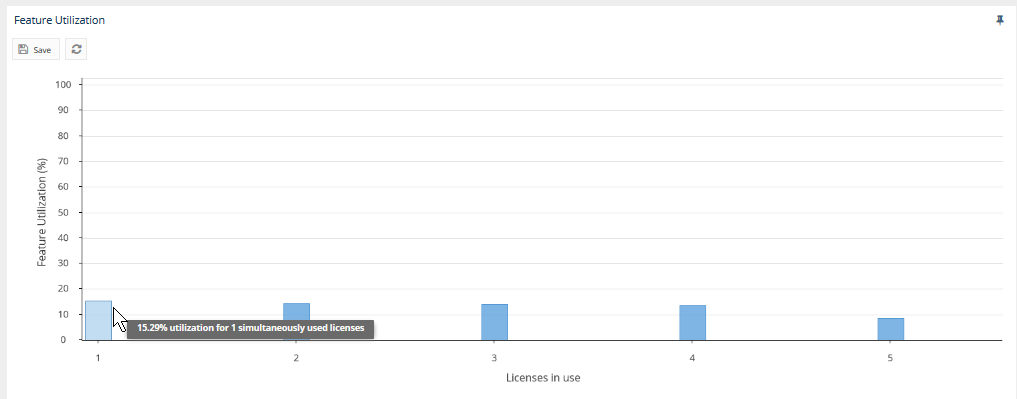
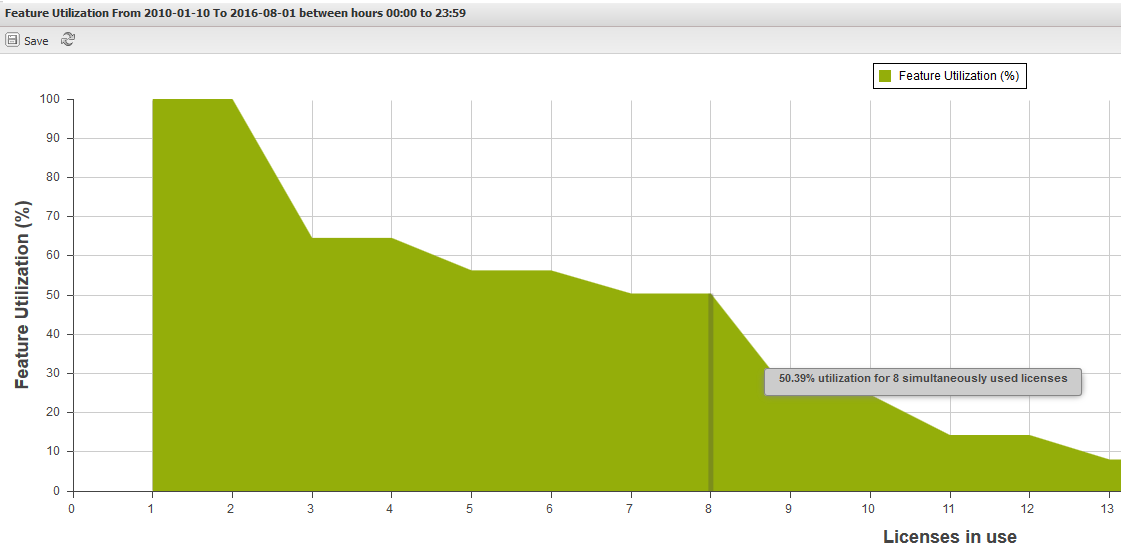
For the Feature Utilization History graph, tooltips show the precise percentage of utilization of a given number of simultaneously used licenses.
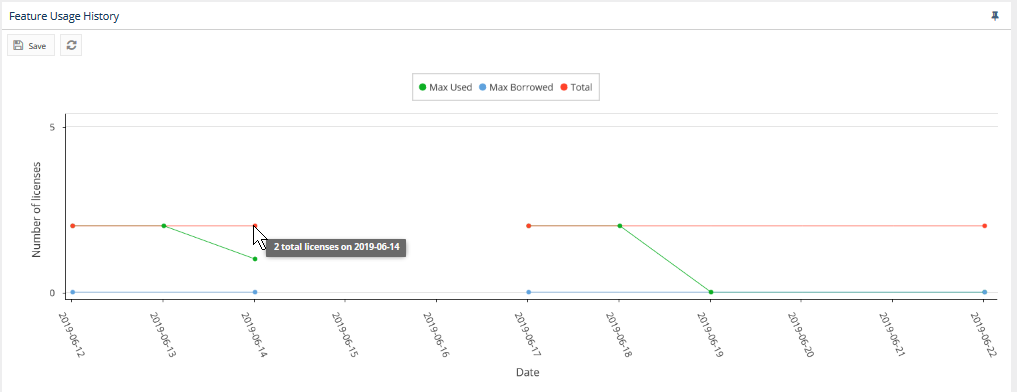
Hiding or showing the display of selected usage details on the graph
...
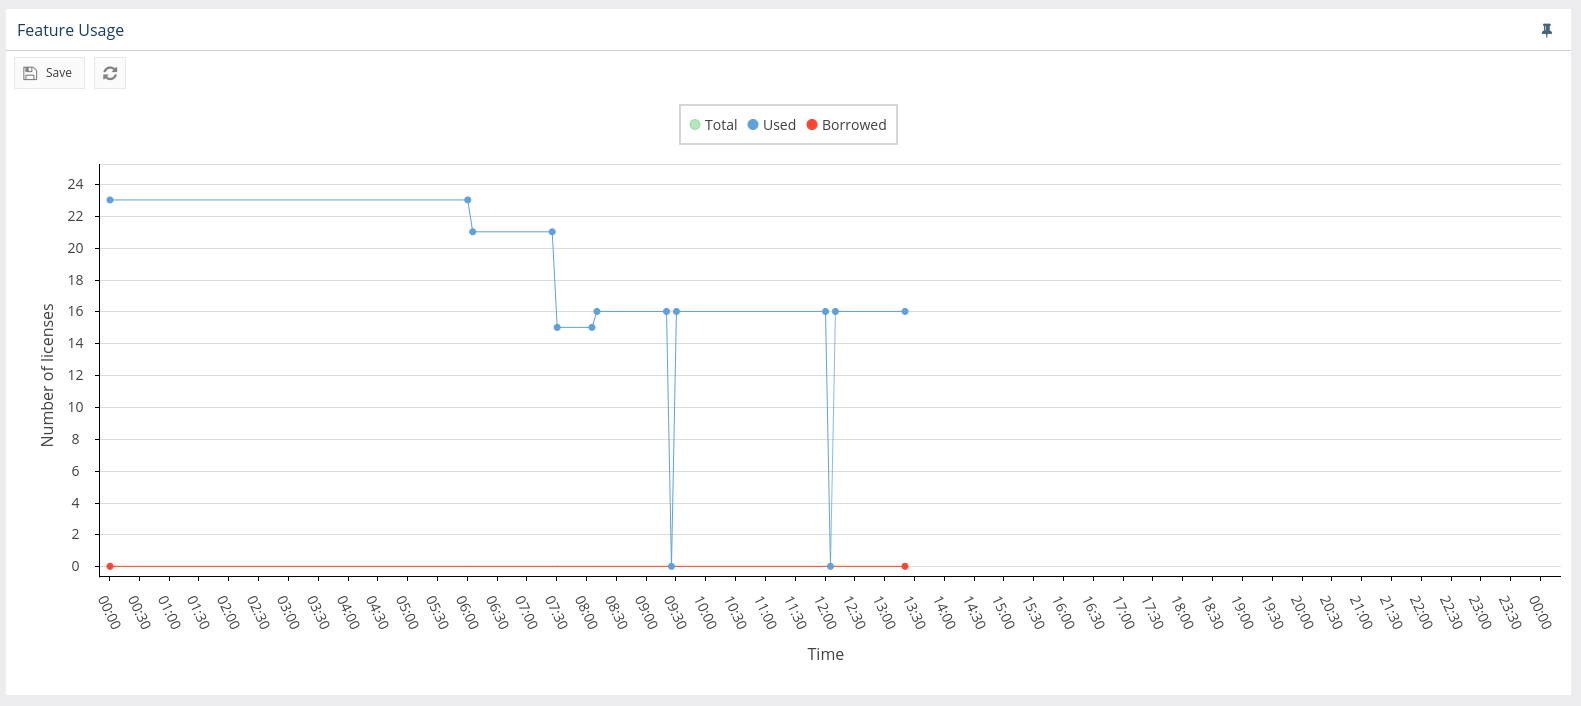
The following graph has total license display disabled (greyed grayed out).
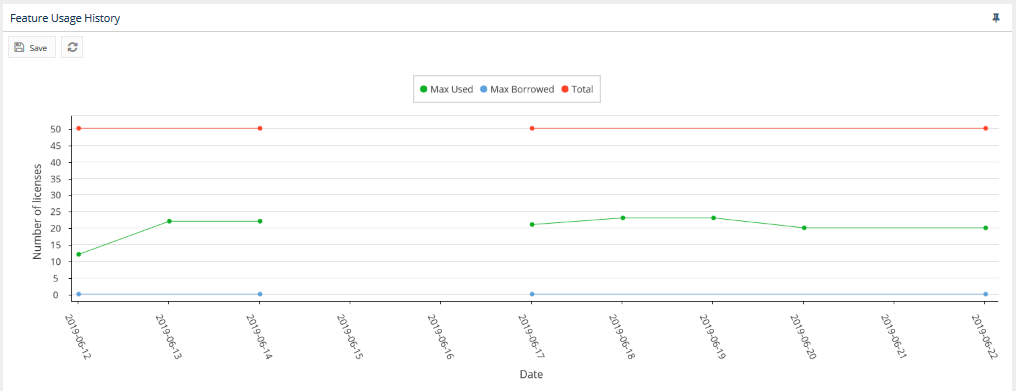
Gaps in collecting data
...
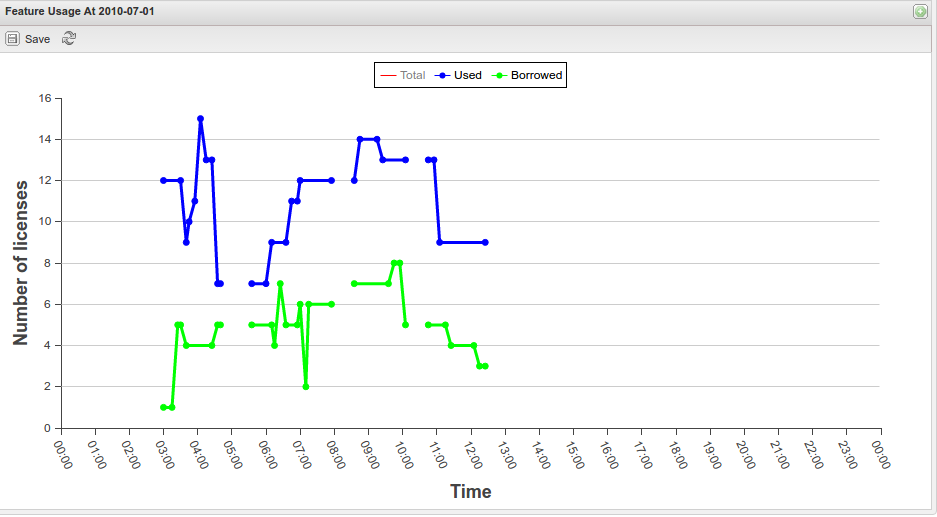
The following Feature Usage History graph from the Usage History report shows periods when data was not collected.