| Warning |
|---|
This |
...
page refers to functionality that has been removed from License Statistics. Reports have been restructured and reorganized as of License Statistics v6. |
...
14. The contents of the Current Feature Usage report have been moved to Features - Realtime - Sessions. |
The Current Usage page under the Features section in the left navigation pane shows the usage statistics for the currently selected feature. You can also select "All" from the License Server pick list to view all license servers.
General Information
The General Information area at the top of the Current Feature Usage page includes identifying information for the feature and a summary of usage information , including for the feature's expiration date, the last update time, a share code if sharing is in use (for example, "Shared on HOST" or "Shared on VIRTUAL"), and a color-coded chart that indicates current count of licenses used, borrowed and reserved, the total licenses available and utilization percentage (if not unlimited).
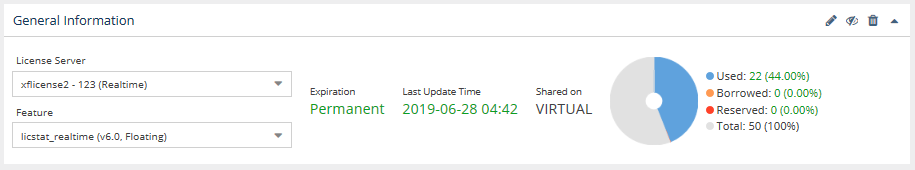
To select a different feature for which to view usage statistics, use the License Server and Feature pick lists in the General Information area.
...
selected feature.
Use the License Server and Feature pick lists in the General Information area to select the license server and feature for which you want to view current usage. You can also select "All" from the License Server pick list to view all license servers.
The Current Feature Usage list includes the user and host (and Host IP, hidden by default) on which the selected feature is checked out, how many licenses that user has checked out, the checkout time(s) and how much time has elapsed since checkout, and for any borrowed licenses, when the borrow time expires.
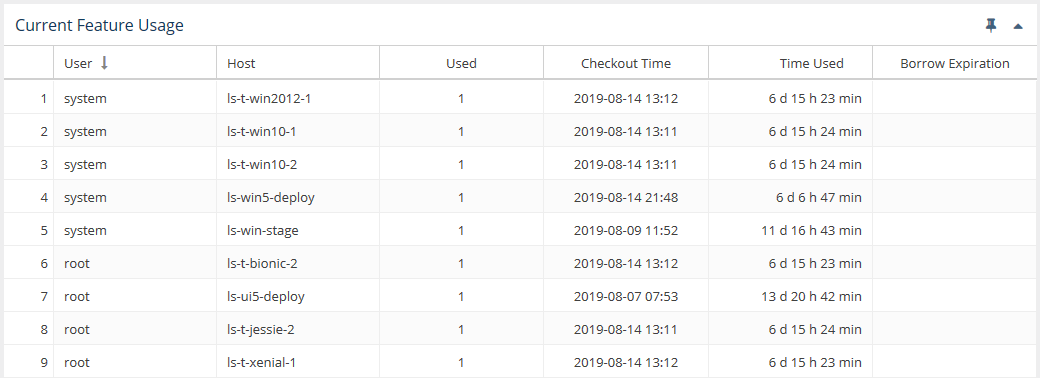
You can add the Current Feature Usage grid to the License Statistics Dashboard. Learn more about customizing the Dashboard.
...
The graph below displays the number of borrowed and used licenses; the display of total licenses is hidden (greyed grayed out). A vertical line (the orange line in the illustration below) shows the current time.
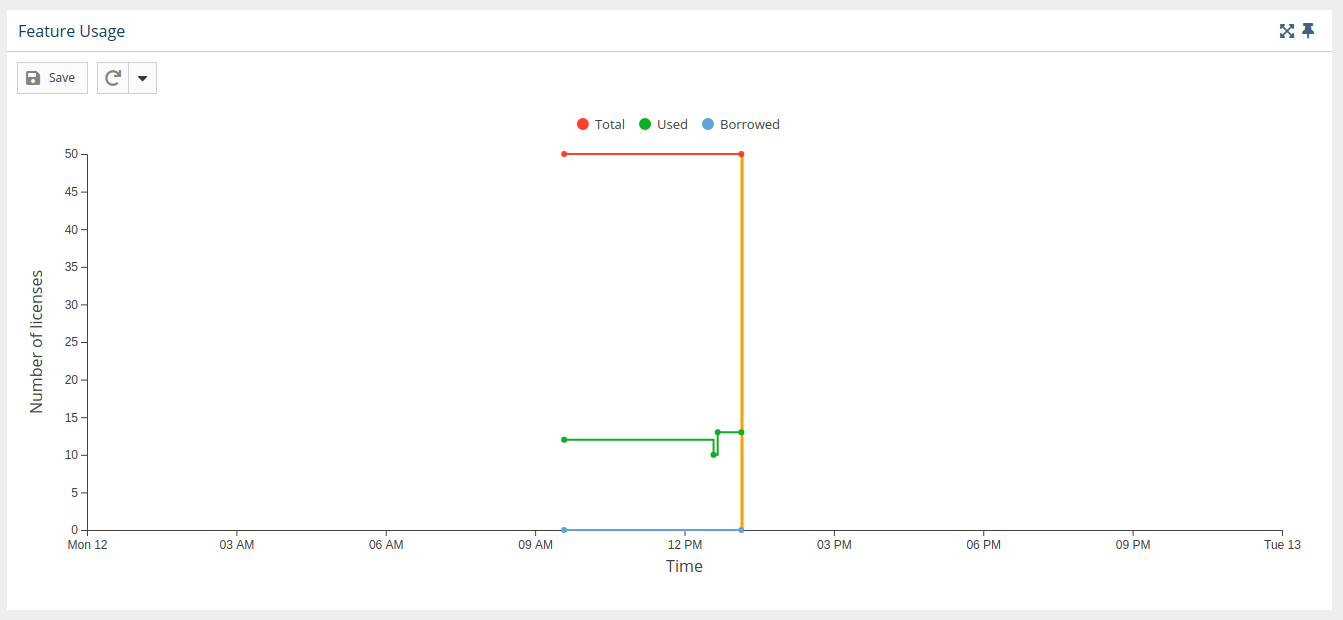
Gaps in collecting data
Empty spaces or "gaps" in the graph indicate periods when License Statistics was not running and data was not being gathered. This can happen due to one or more of the following reasons:
...
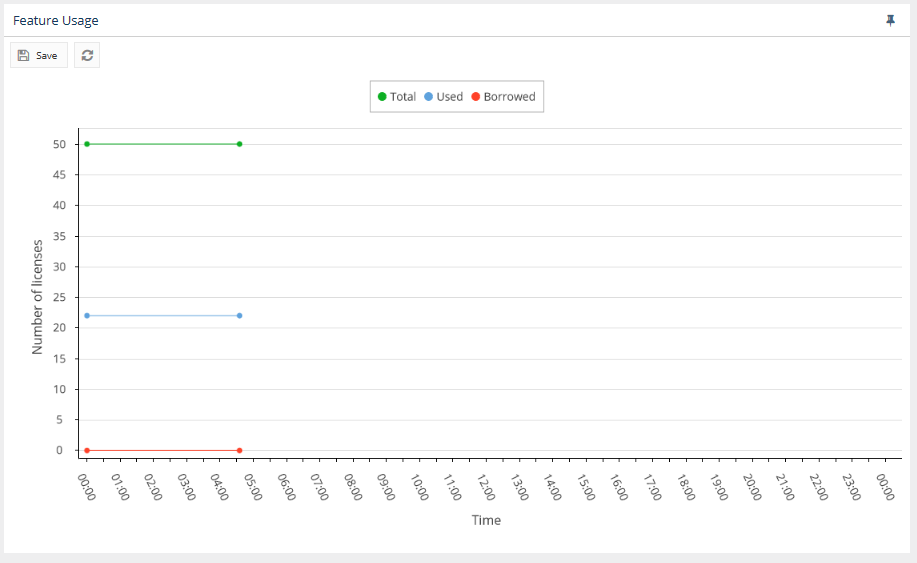
Use the Advanced Filtering area to choose whether to show total licenses on the graph. (You can seeSee Feature usage graphs for more information about using graphs.)