...
To see a report on the usage of feature, select the Usage Per User tab from the Reports page.
General
...
information
The Usage Per User report shows lets you monitor license usage information for all features or a selected feature, for one or all monitored license servers based on the selected type of aggregation to use for the report (described below). With this type of report , you can change time constraints, as appropriate for your needs; for example, you can focus on collect license usage from the perspective of one monthinformation on a monthly basis, but limit the results shown to weeks.
Before you produce a Usage Per User report, you can specify the type of aggregation to use for the report. You can also group feature usage information, as described in subsequent sections, below.
Types of aggregation
The Usage Per User report lets you specify the type of aggregation by which you can aggregate the results for the report. If the aggregation type is not specified, the report will be aggregated by Username and Hostname. Available options are:
...
How aggregation is applied in a report
The minimum aggregation value you can specify is User on Host, which means that this unit that cannot be split further. The values for other available aggregations such as Hours Used/Borrowed, Max Used/Borrowed and Max Usage, are calculated using different aggregation methods (for example sum), based on the calculations of the values set for User on Host for a particular moment of time.
Example
Aggregation is the process of consolidating multiple records into a single record. For example, license usage information can be collected on a daily basis and aggregated into a value for the week, the weekly usage information can be aggregated into a value for the month, and so on.
Example
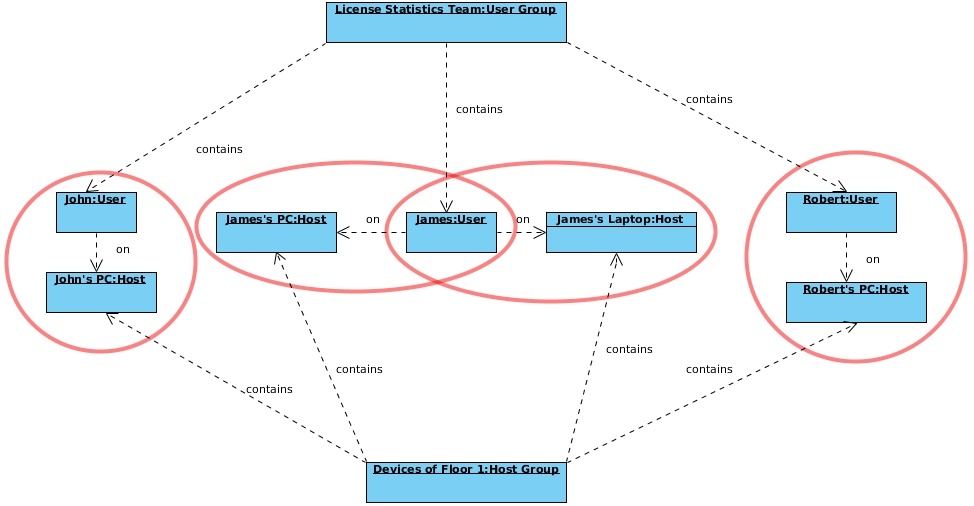
Let's look at the following diagram to better understand how the selected type of aggregation affects the results shown in a report. In our example Let’s assume we have selected to show feature usage information for a particular Usergroup. As shown in the diagram below, we can split this usage information into information for particular Users. This information can be split even further into usage for User on Host. This mechanism shows that the values of usage for User are aggregated values of User on Host.User Group.
Grouping feature usage information
...
| Column | Aggregation Type | Scenario | Remarks |
|---|---|---|---|
| Hours Used/Borrowed | User | In our example, the results shown in the report are limited by Day. Scenario 1 The user uses 1 license for 8 hours. Calculation: 8 hours = 8 Hours Used Scenario 2 The user uses 2 licenses for 1 hour and , then 10 licenses for 2 hours and 1 license for 2 hours. | When you choose to use a different aggregation type or when you decide to group by a different value, the sum of the values will be displayed for the following: a). Days in a time frame b). Entities (for example; user, host) in a particular aggregation. |
| Max Used/Borrowed | User | In our example, the results shown in the report are limited by Day. Scenario 1 The user uses 2 licenses in 1 throughout the day. Calculation: 2 licenses = 2 Max Used/Borrowed Scenario 2 The user uses 2 licenses in 1 day, but for 1 hour he uses only 1 license Calculation: 2 licenses = 2 Max Used/Borrowed | When you choose to use a different aggregation type or when you decide to group by a different value, the highest value will be displayed for the following: a). Days in a time frame b). Entities (for example user, host) in a particular aggregation. |
| Max Usage | User | In our example, the number of available licenses for a particular feature is 10. Scenario 1 The user uses 2 licenses in 1 throughout the day. Calculation: 2 licenses out of 10 licenses = 20% Scenario 2 The user uses 5 licenses for 1 throughout the day, but only 2 licenses are used for 1 hour he needs and uses only 2 licenses. Calculation: 5 licenses out of 10 licenses = 50% Scenario 3 The user uses 3 licenses in 1 throughout the day, but 8 licenses are used for 1 hour he needs and uses 8 licenses. Calculation: 8 licenses out of 10 licenses = 80% | When you choose to use a different aggregation type or when you decide to group by a different value, the same method of calculation will be applied. It should be noted that the Max Usage value may serve as a warning signal, giving you information about the highest values of feature usage. It is worth considering if the values represent a one-time event or a tendency. |