...
- Create a token with API scope in License Statistics.
- Add a Web data source to Power BI.
- Prepare the License Statistics API data for use with Power BI BI.
- Use the prepared License Statistics data to create a Power BI report.
These steps are detailed below.
...
- Create a new report.
- From the "Get data" menu, select Web as the data source.
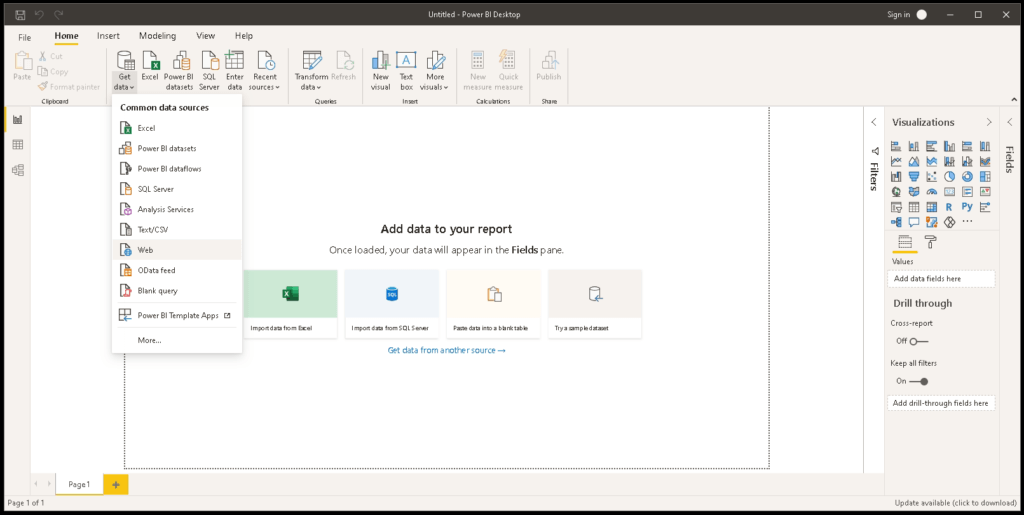
- Complete the form that displays.
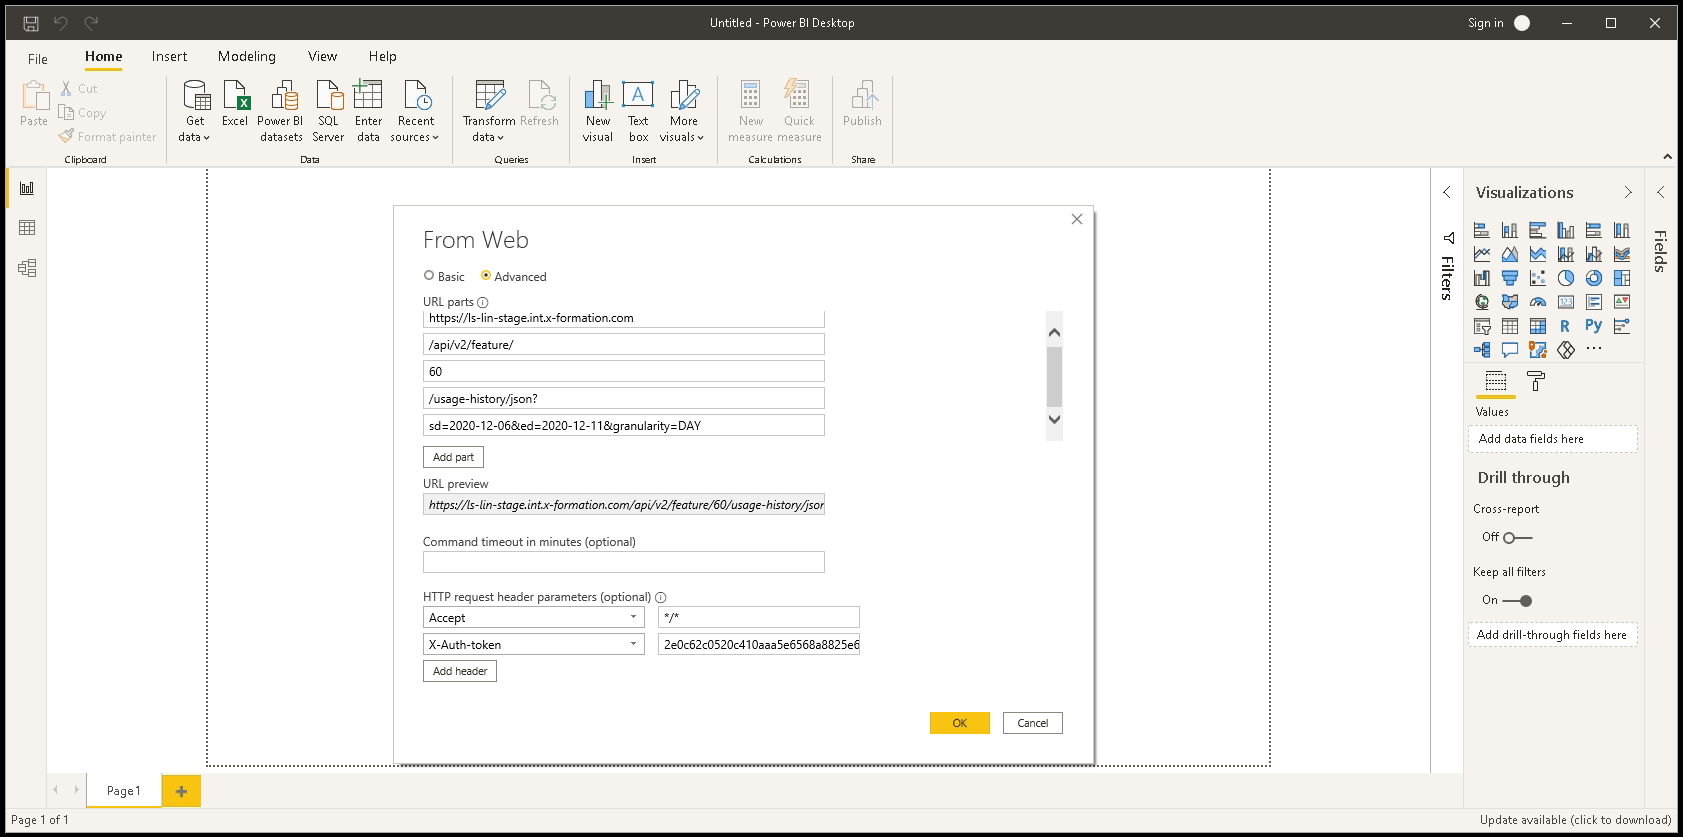
- Toggle the form to Advanced.
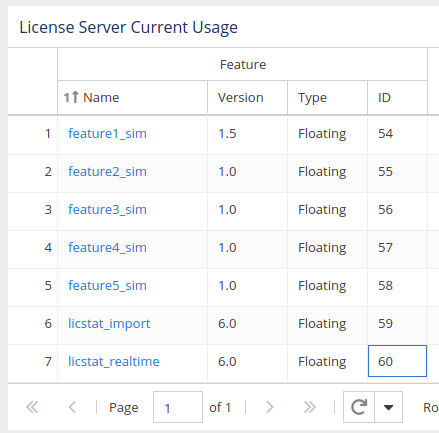
- Add to add the API endpoints (URL parts) and click Add part to see the URL preview. The example above uses the endpoint "/api/v2/feature/ID/usage-history/json," where the ID variable (set to 60 in our example) can be retrieved by using the "/api/v2/feature/list" endpoint or from the Feature ID column in any License Statistics grid, as shown in the illustration below. (The Feature ID column is hidden by default, so you may need to toggle its visibility on.)
- Set the query parameters; for . For our example, you might we set a start date of December 6, 2022, and an end date of December 11, 2022, using the following parameters (see API endpoints for a complete list of API endpoint parameters):
- sd=2022-12-06
- ed=2022-12-11
- granularity=DAY

Add At the bottom of the form, add the appropriate HTTP request headers; for our example:
- Accept: */*
- X-Auth-token: {API token value}
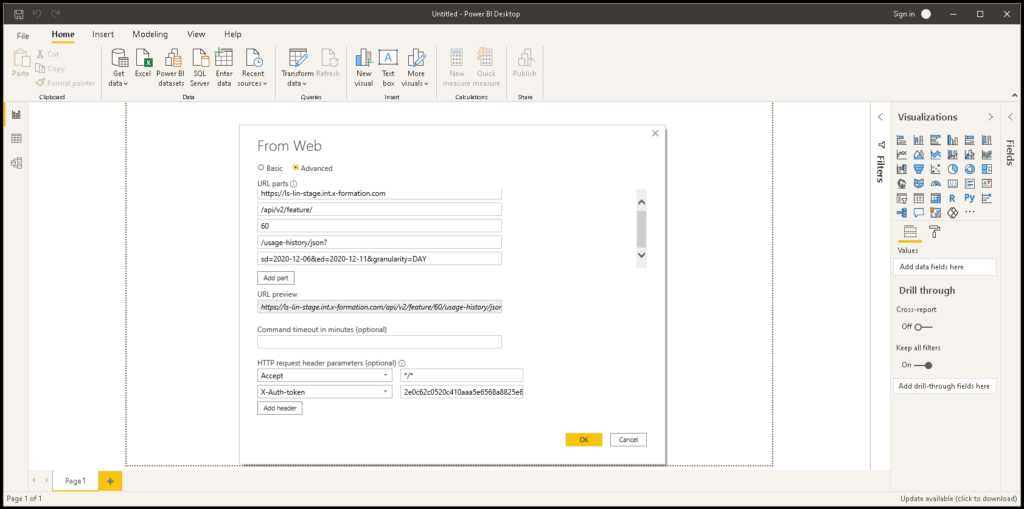
- Click OK to accept the completed form.
- When prompted, use the Anonymous access option. Authorization has been handled by the token we added to the header in the previous step.

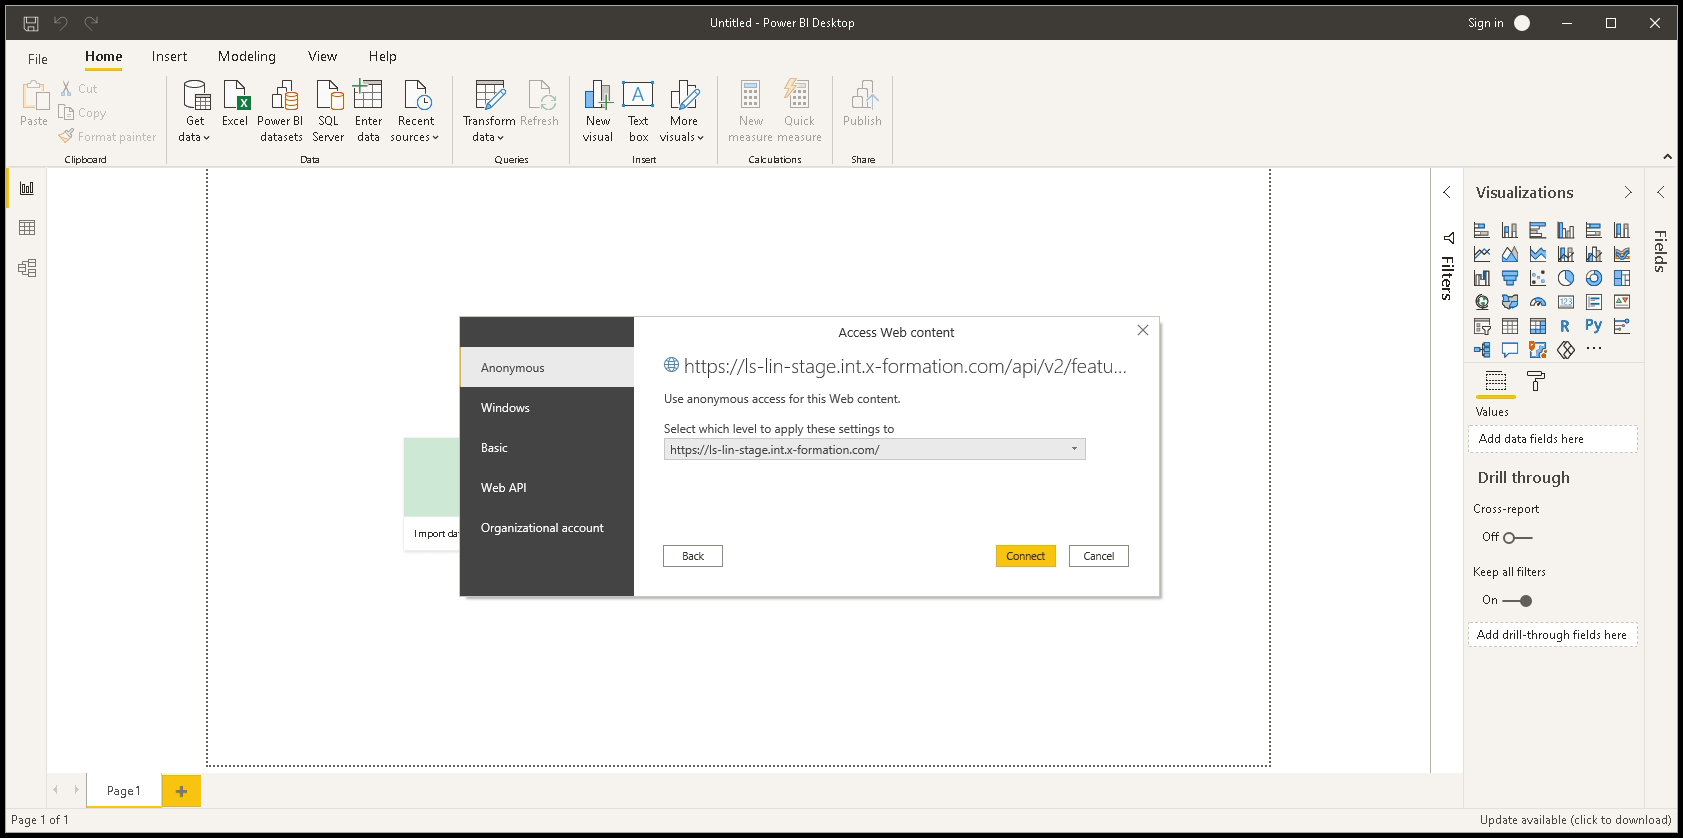
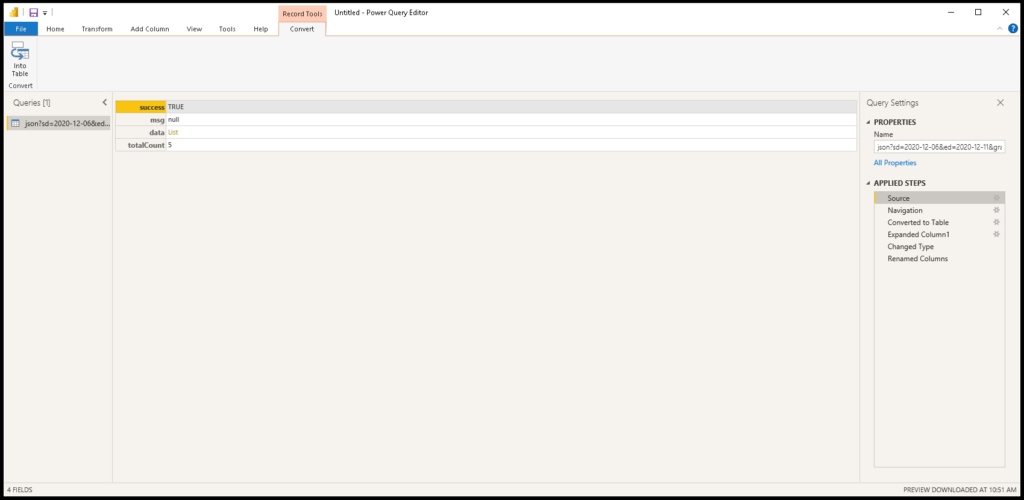
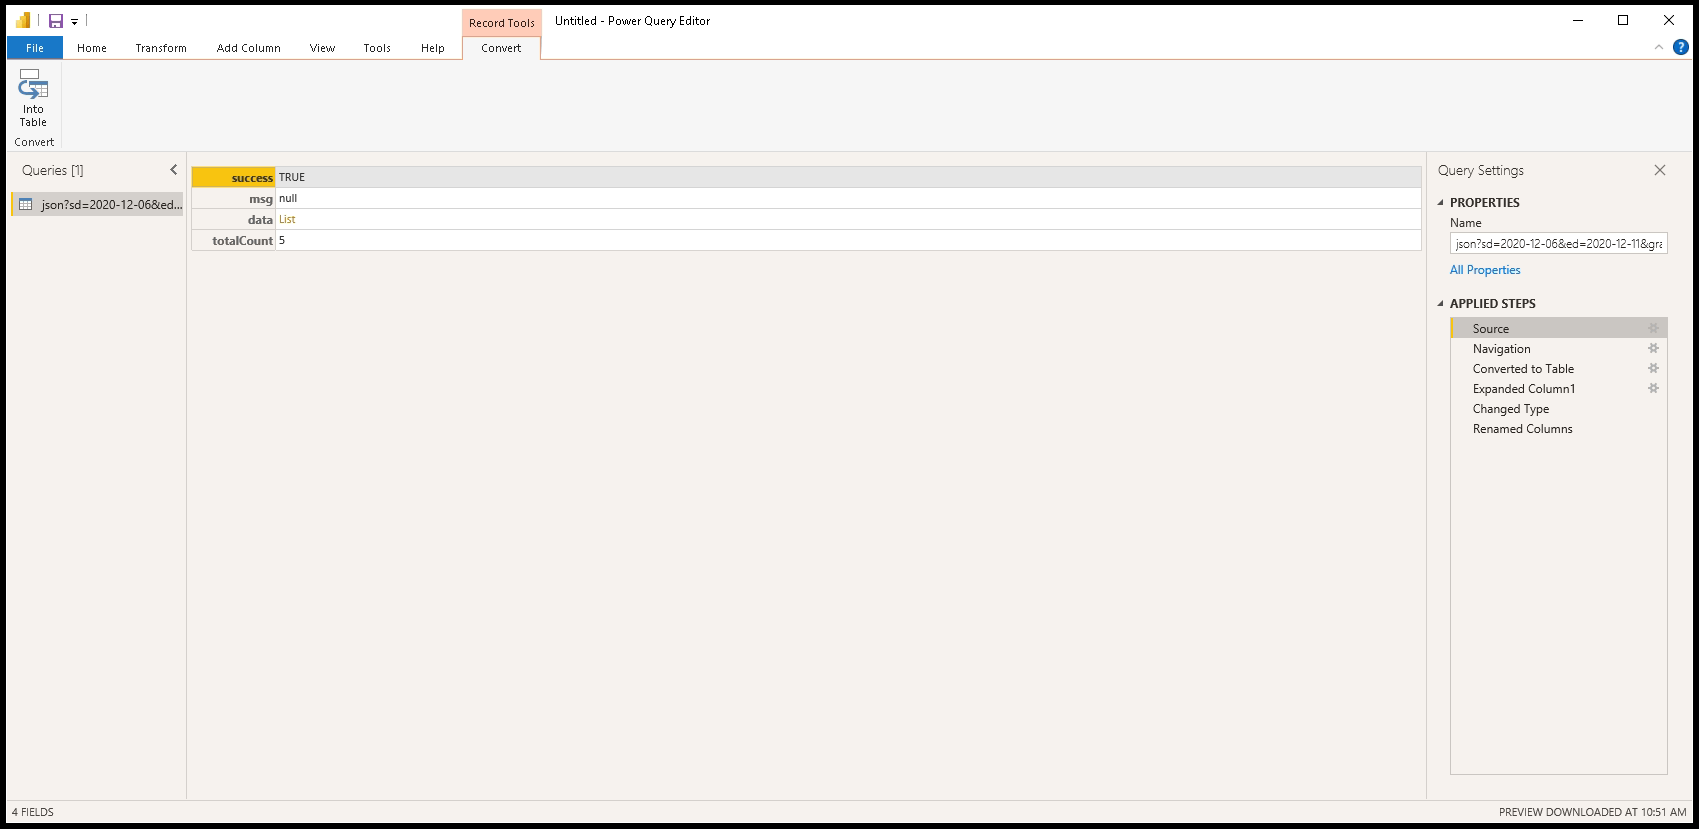
Click Connect to access the defined Web source and get the requested data, which appears as shown below.
Prepare the data
...
- Click List to navigate to the data key details.
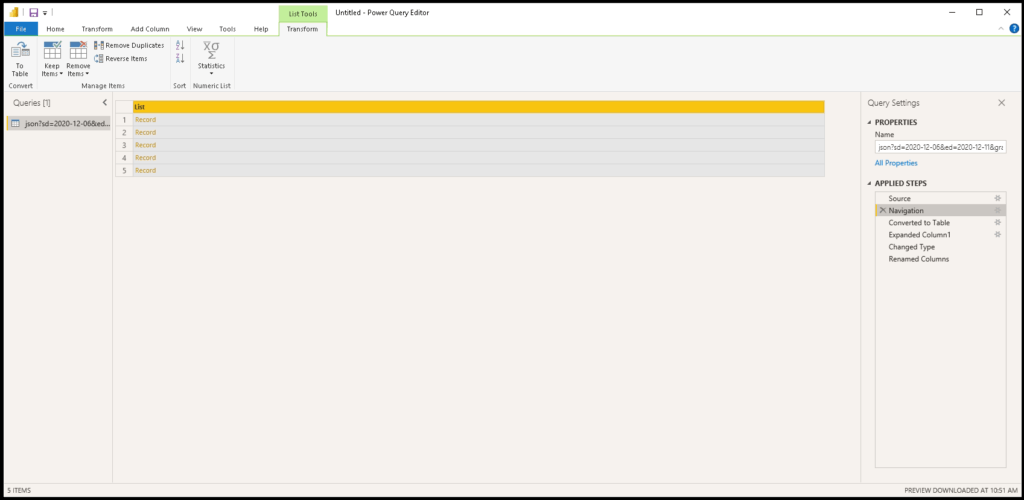
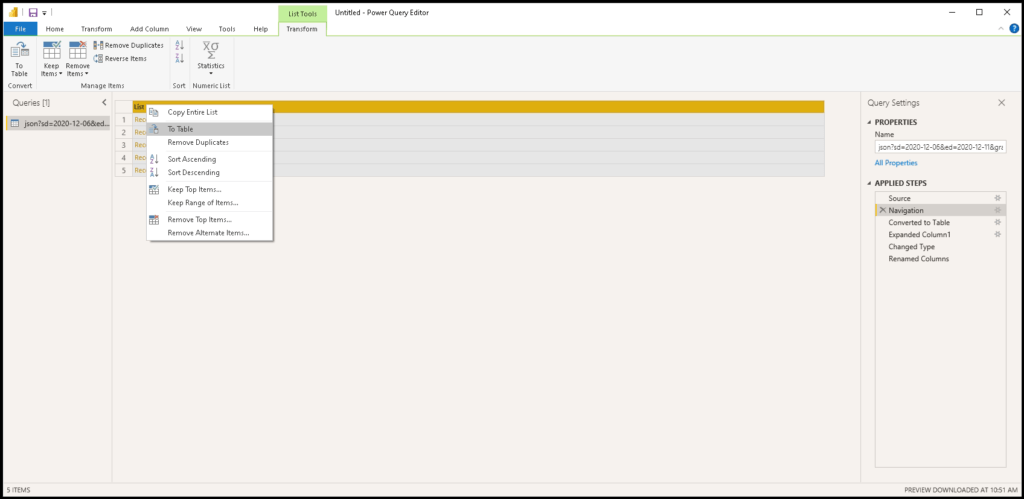
- Convert the list of records to a table using the "To Table" option.

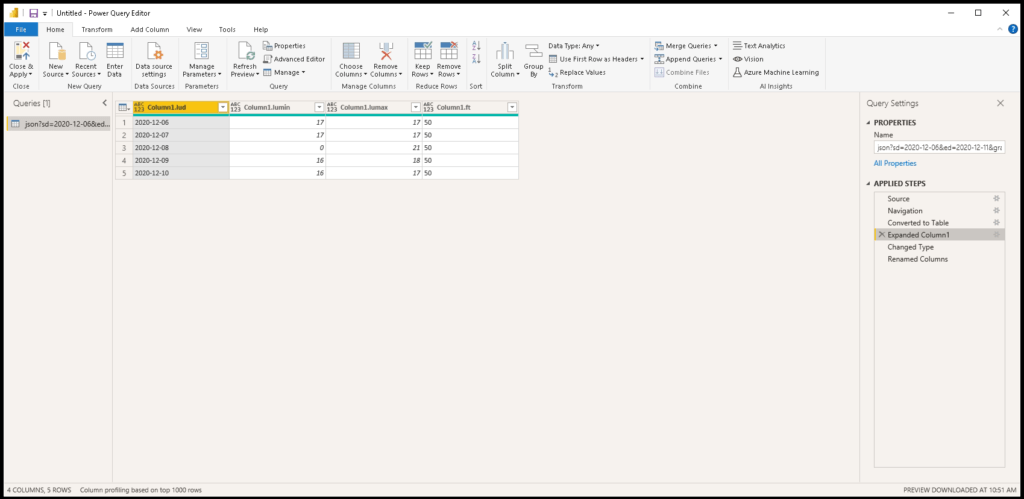
- The results appear as shown below.

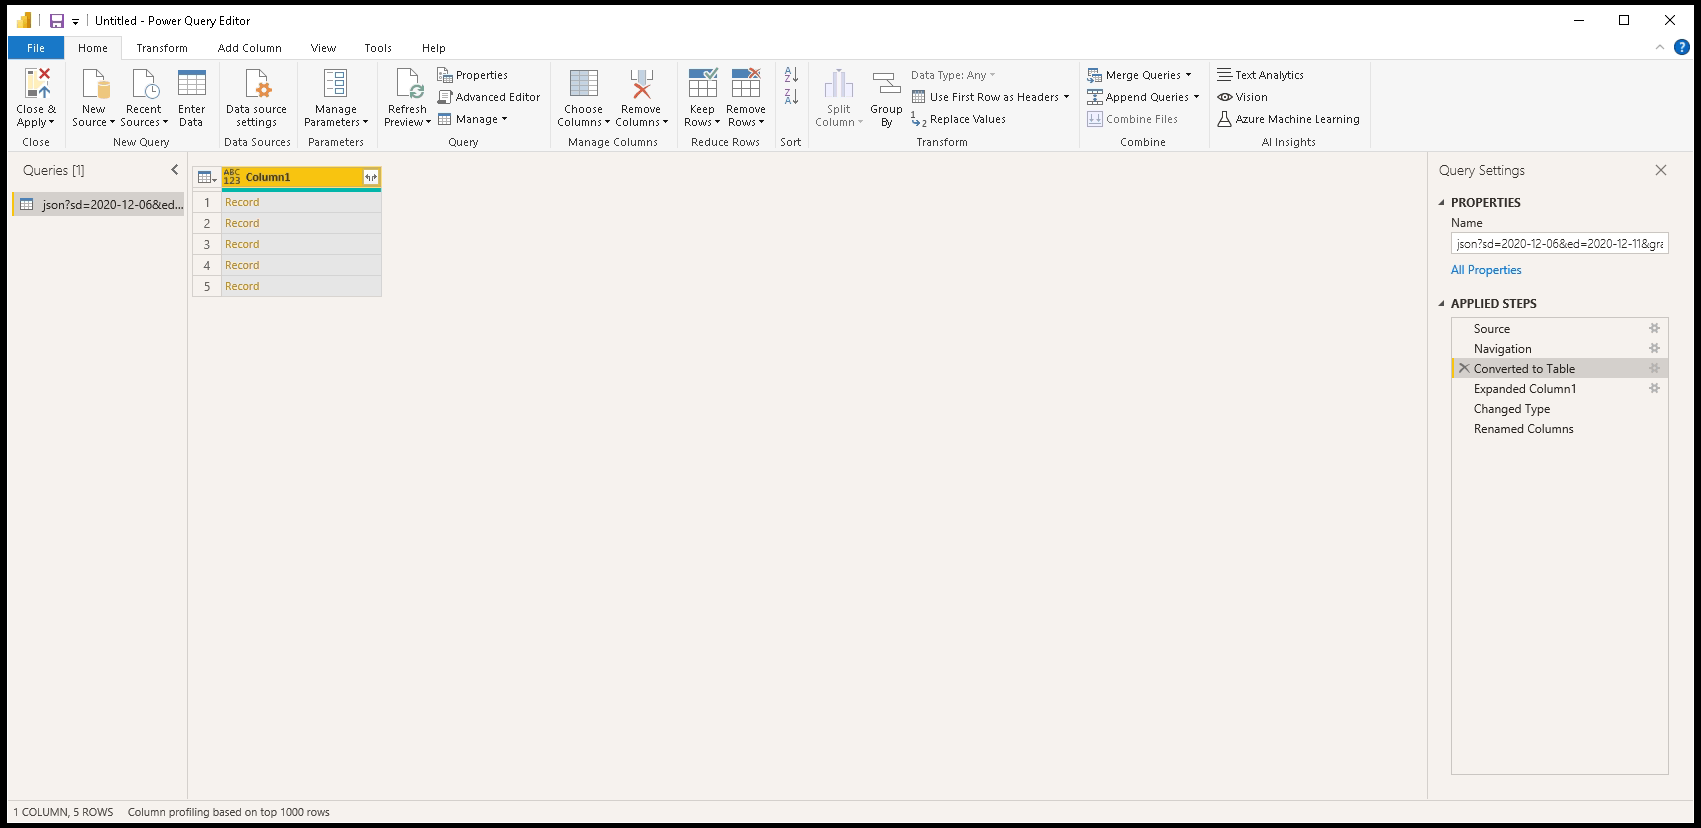
- The resulting Table of records can be expanded to include multiple columns. Select the fields you want to include in your report from the response that are needed for your desired report. (Note: You can also set a list of returned columns using the fieldsVisibility request parameter.)
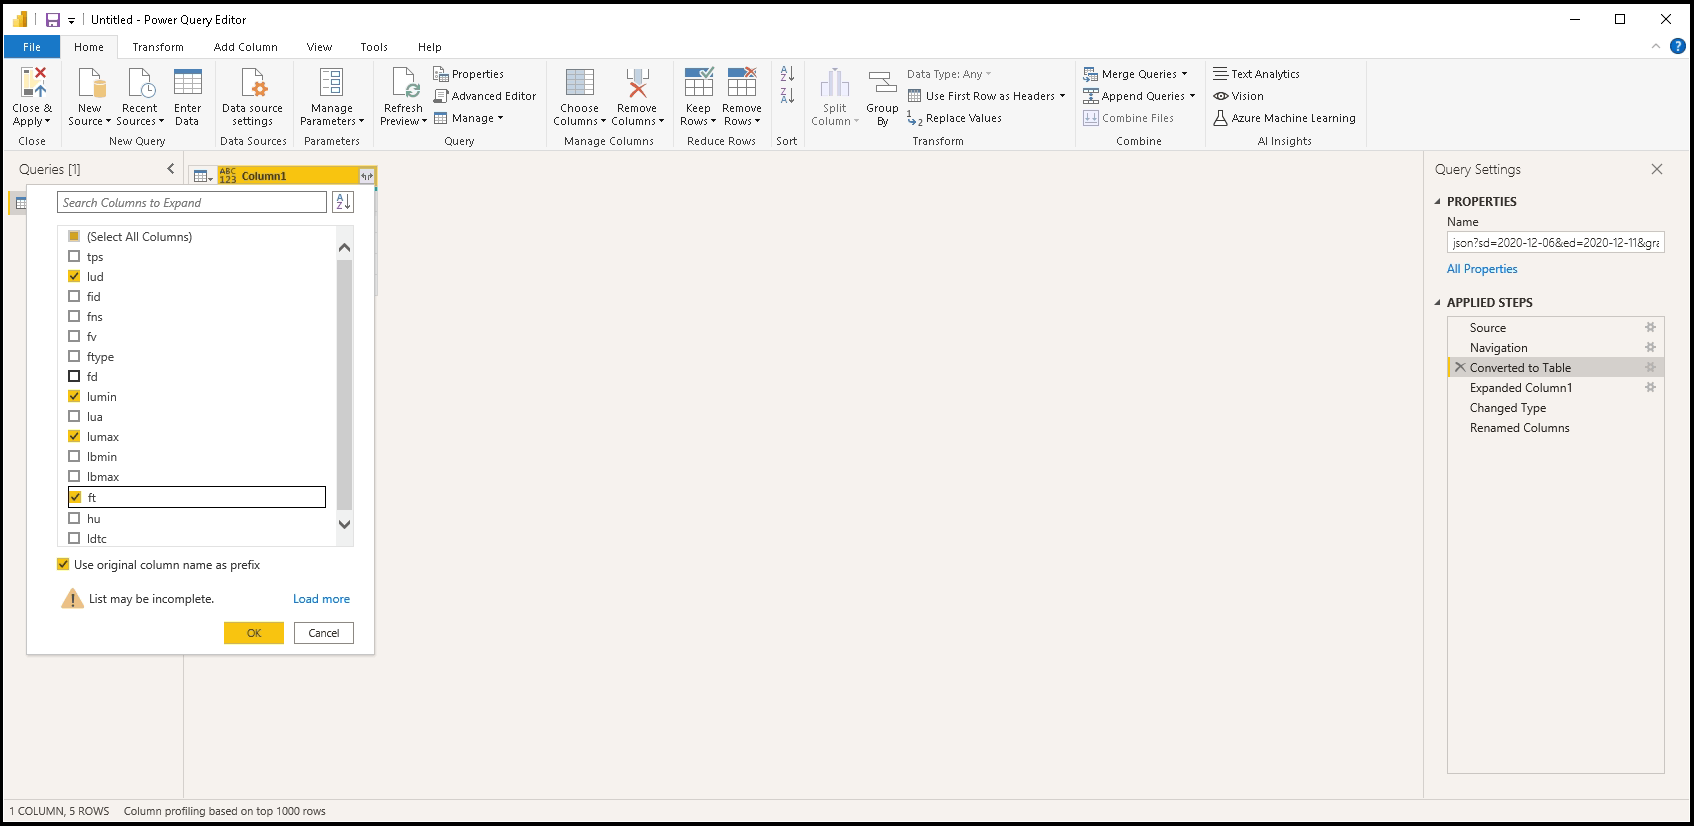
For our example, we 'll choose selected the following fields:lud (date)
lumin (min used)
lumax (max used)
ft (total)

- Click OK after you've selected the desired fields. The table will be expanded to a multi-column view.
Note: See API endpoints for a full list of parameters along with descriptions.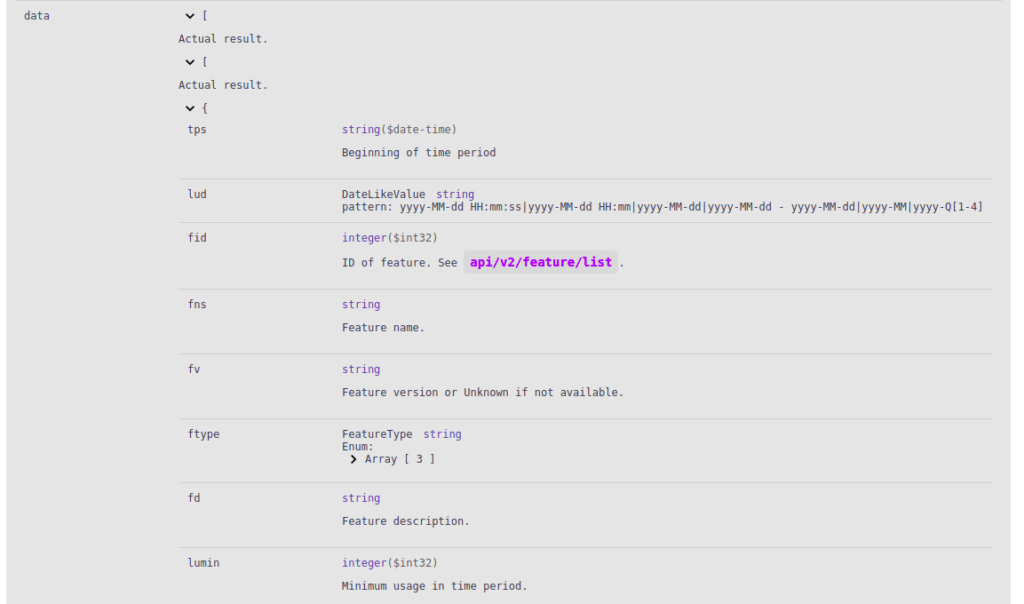
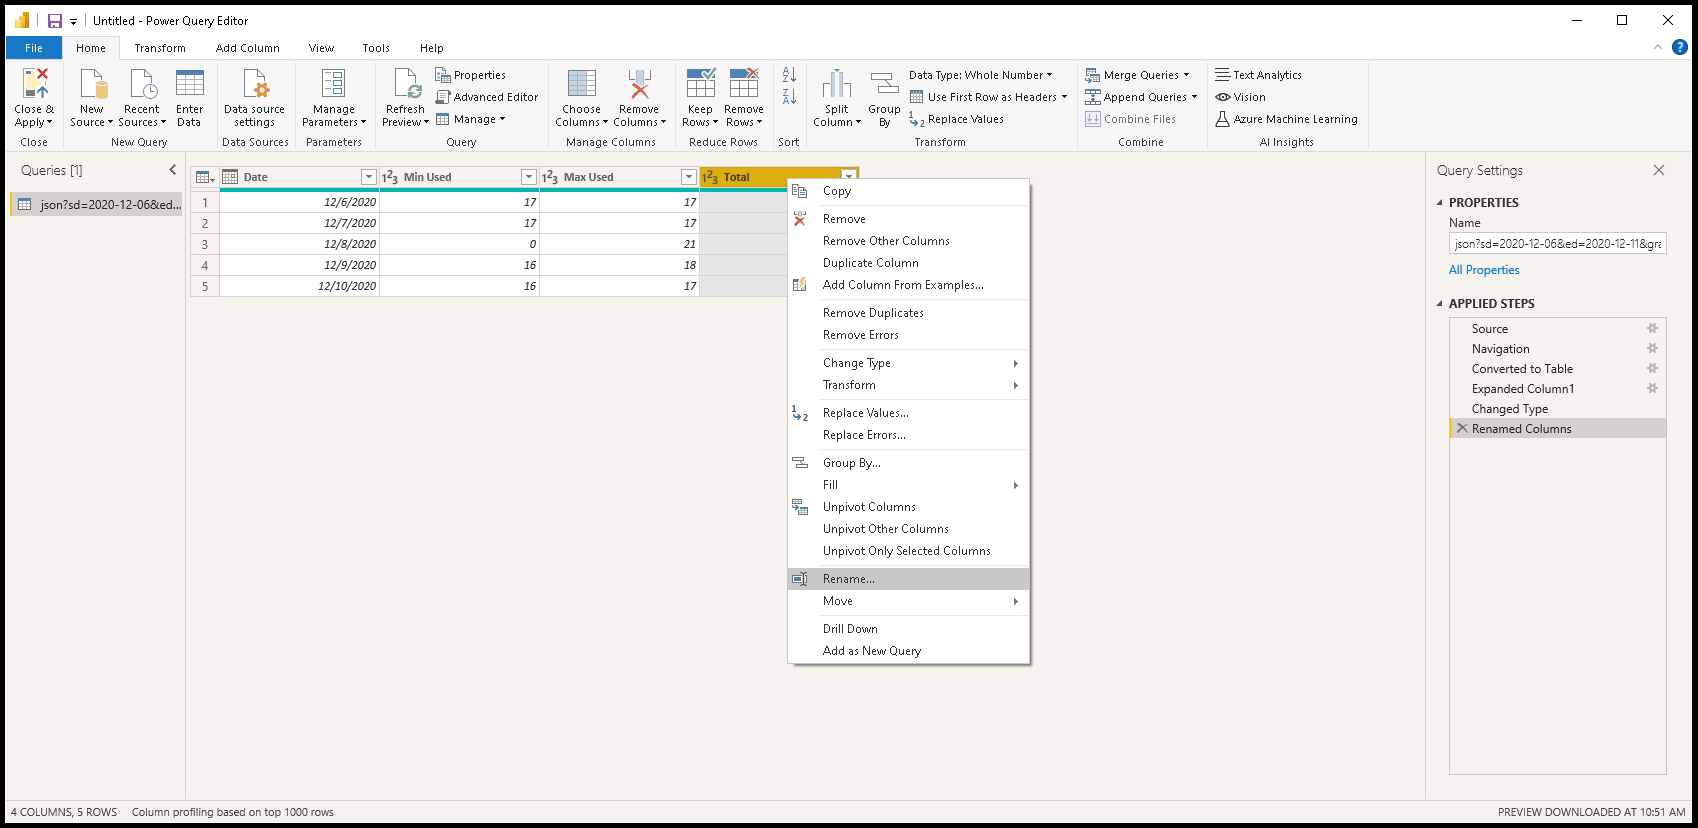
- For proper processing, define the type of data for each column. In our example, the lud property is a Date type, while the rest of the properties are Whole Numbers.

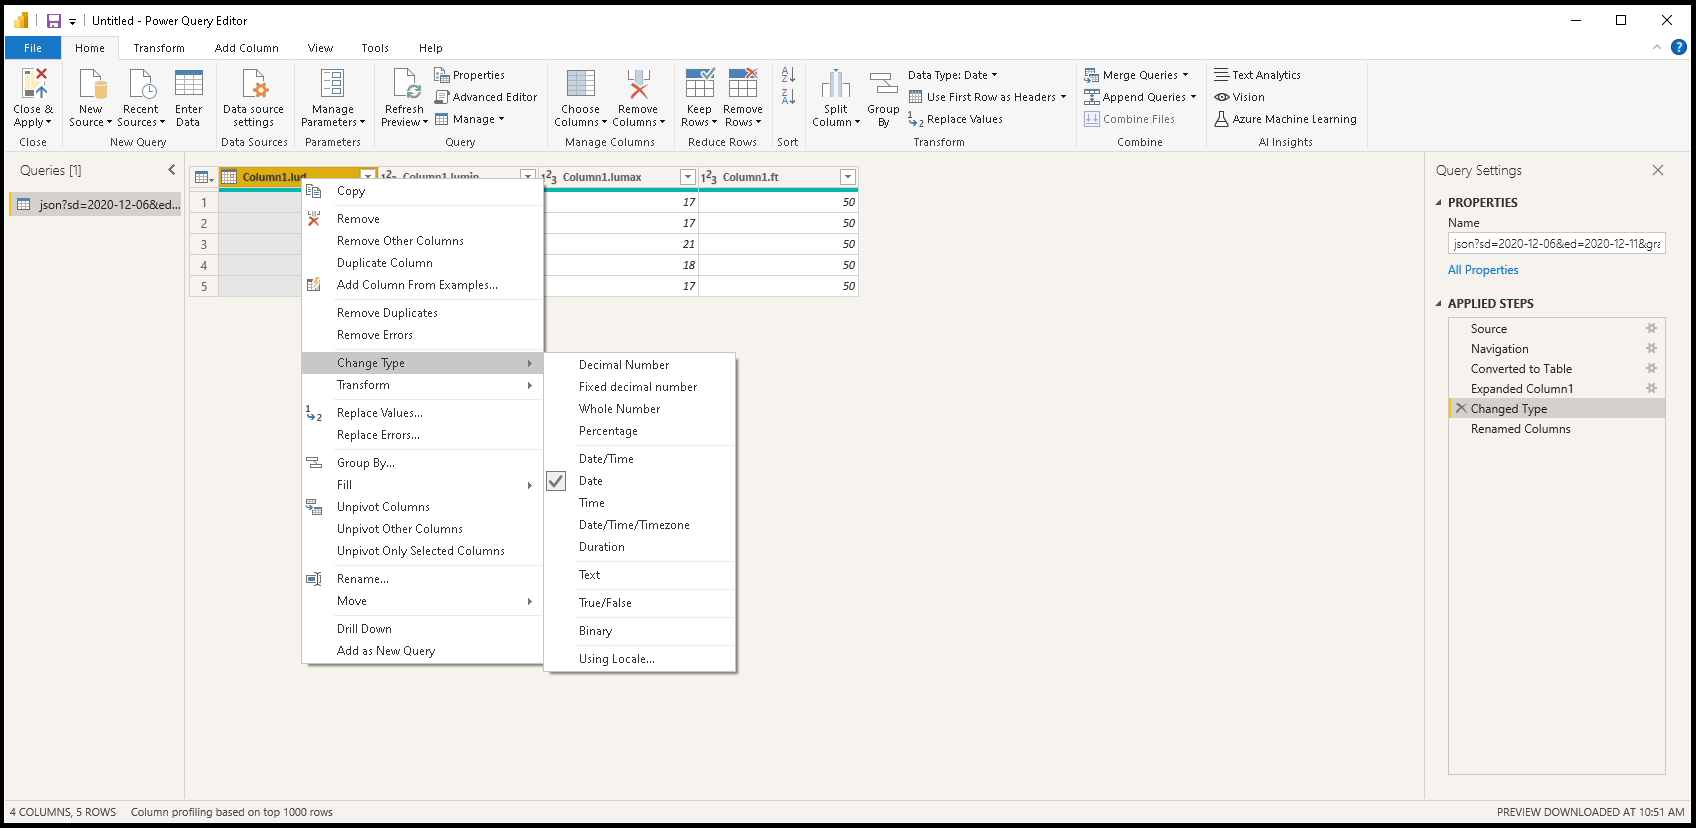
- Rename the columns so they will be understandable in the reports.

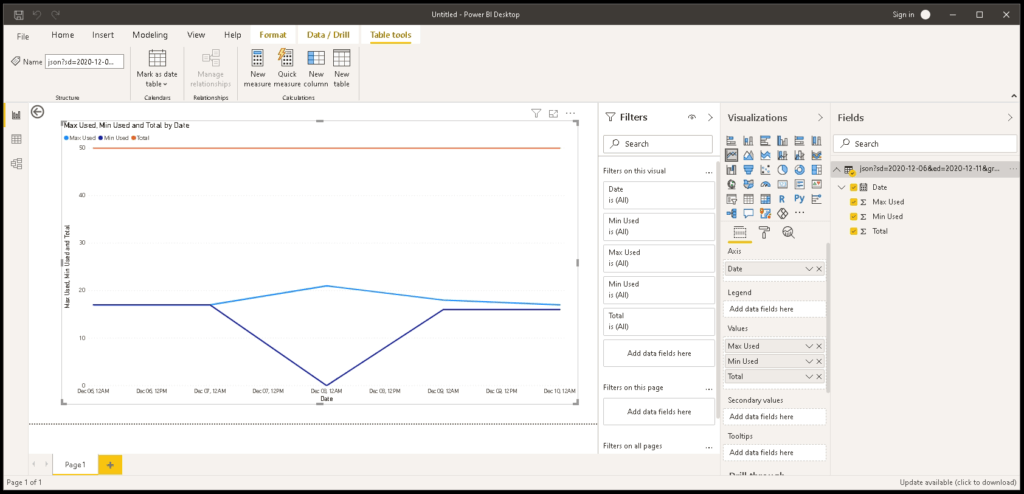
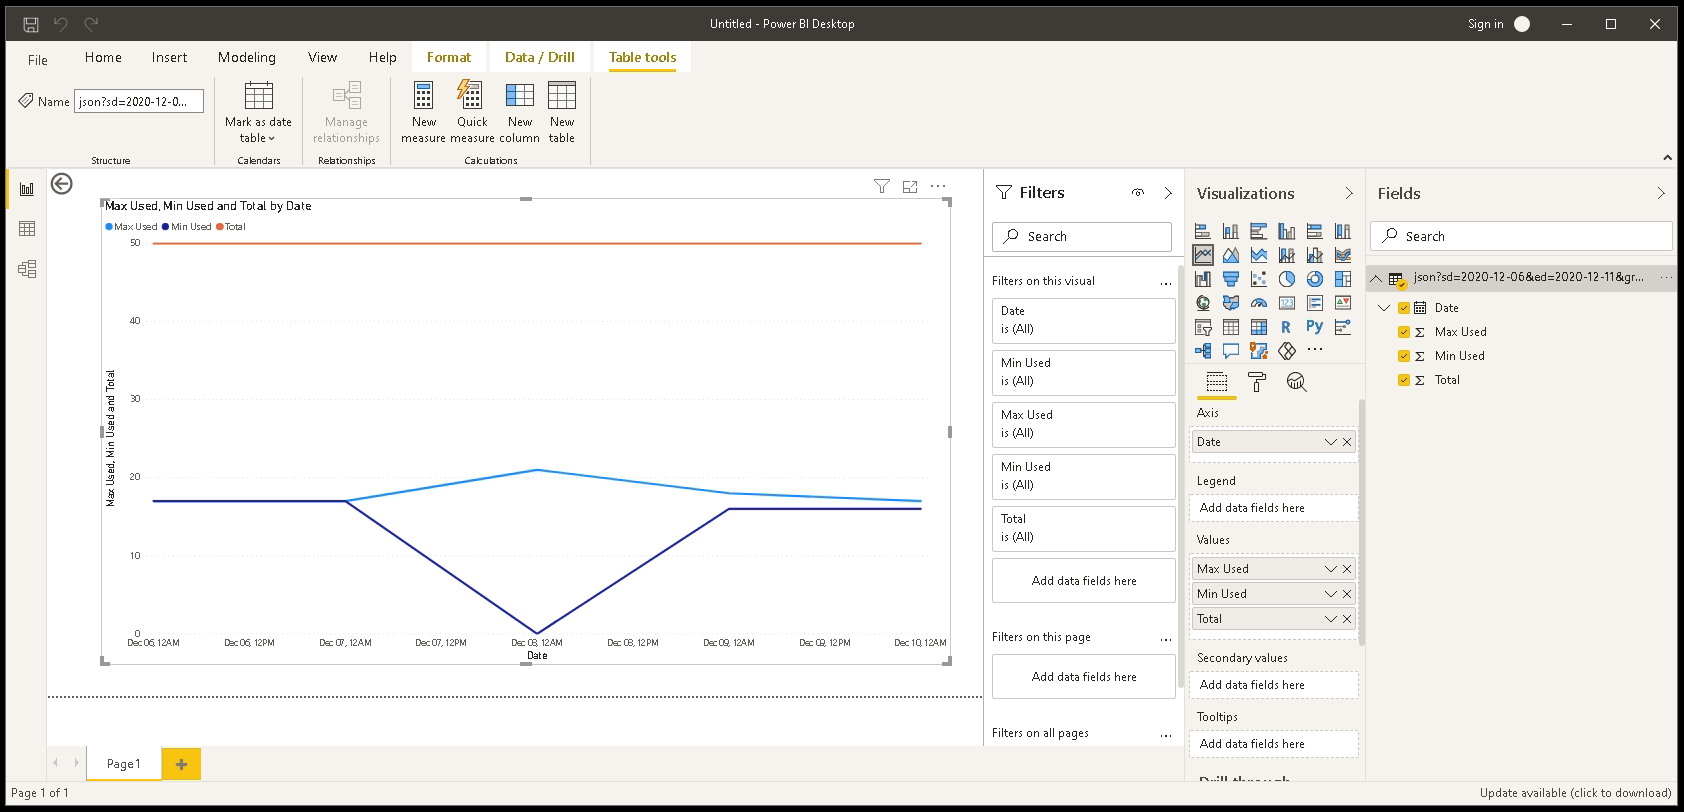
Create a report in Power BI using the License Statistics data
...
For our example, we created a line chart with a date on the X Axis and, on the Y Axis, the values from the three data series: Max Used, Min Used, and Total.