The information on this page refers to License Statistics v6.14 15 and newer, which reorganized reportsadded "Available" license count to the Features Realtime Usage report. If you are using a version previous to v6.14, see Removed Features. Also note that for a limited time, the old menu structure in the License Statistics UI will be retained, so if you cannot locate what you're looking for with the new menu structure, you can try locating it using the old structure15, see documentation for previous versions. |
The Usage page under the Features: Realtime section in the left navigation pane shows information about the license server and its features.
...
.
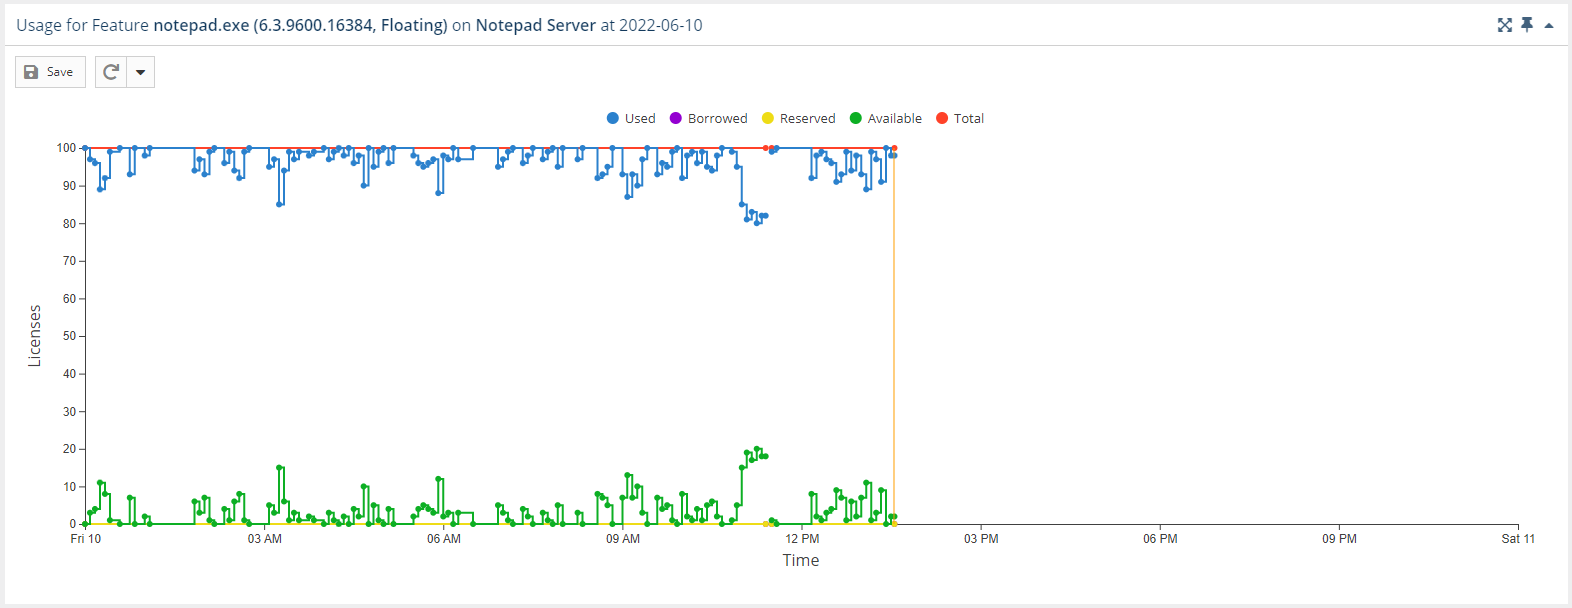
Feature Usage graph
The Feature Usage graph gives you a visual picture of the number of licenses used throughout the day. (See General use of feature usage graphs for additional information about feature usage graphs.)
You can toggle the visibility of graph lines for used, borrowed, reserved, total, and available licenses by clicking the relative items in the legend at the top of the chart. For example, clicking "Total" on the graph legend will hide/show the graph lines for the total number of licenses.
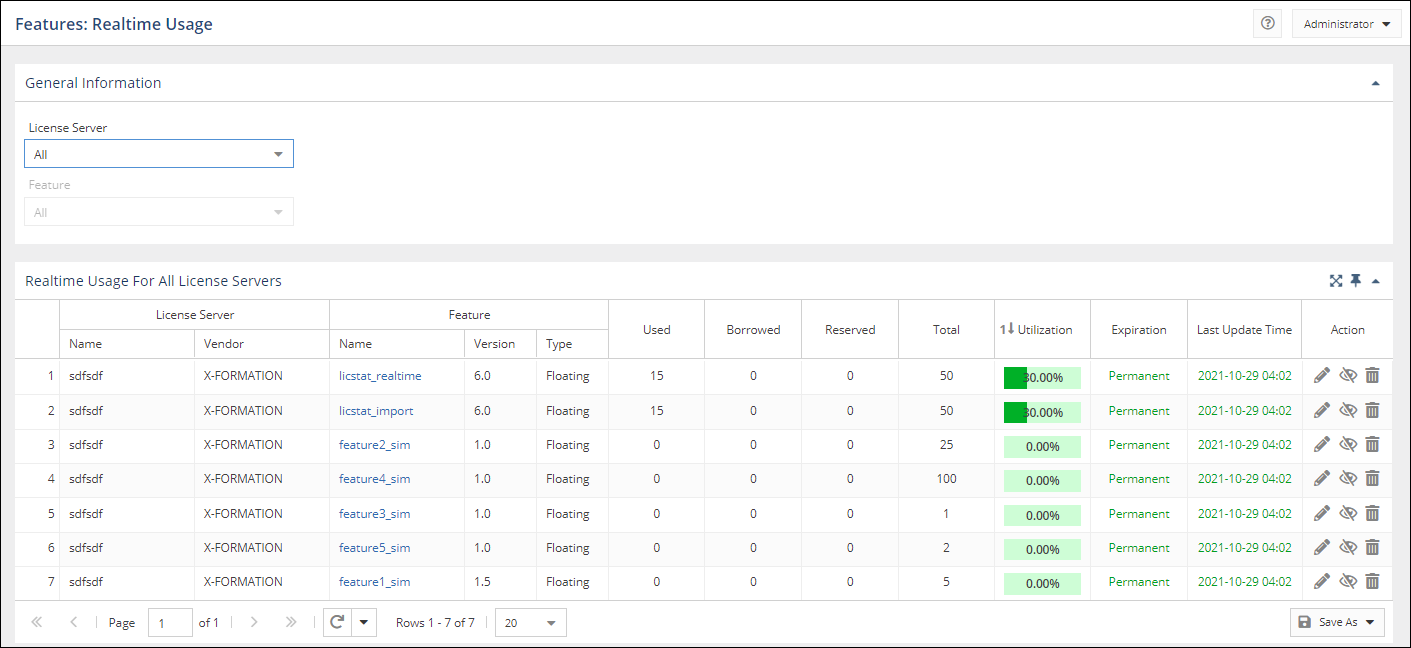
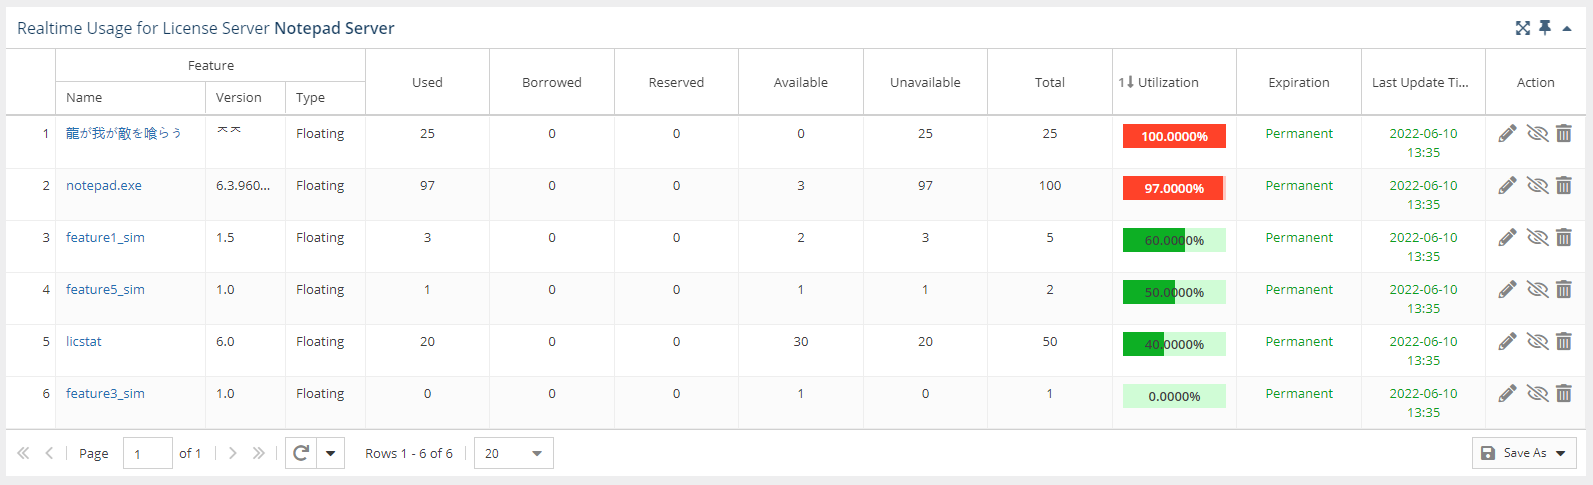
Features Realtime Usage grid
The License Server Current Features Realtime Usage grid lists all the features that are currently reported by the license server. Use the License Server and Feature pick lists at the top of the page to select the license server and feature (if the license server has multiple features) for which to see details. To see all features for the selected license server, select "All" from the Feature pick list. You can also view details for all license servers and features using the "All" License Server selection (the Feature selection defaults to "All" when you select "All" from the License Server pick list).
For each feature, you can see how many licenses are in use, borrowed, and reserved; the total number of licensestotal number of licenses; number of licenses that are available (total licenses minus the number of used and reserved licenses) and unavailable; percentage of utilization; license expiration date; and the last update time, as shown below. For the new licensing model Licensing Model 2019 only, when the Reserved value is greater than 0, the Reserved column includes a link to the Feature Reservations page.
Need better illustration that shows varying utilization percentages
Note: Features that are not current (that is, had no usage reported in the last query interval performed by the license server) are not included in this report. Therefore, expired features won't be shown in this report unless they have current usage (some license servers may allow use of currently checked out features even after those features have expired).
How License Statistics counts licenses
Sometimes one feature can have different expiration dates. For example, you may have 10 licenses for feature "F1", which expires on 2017-02-15, and additional 7 licenses for the same feature, which is due to expire on 2019-02-15.
License Statistics treats both groups of licenses for feature "F1” as “pools” of licenses, but instead of summing up all licenses, it ignores licenses which that have already expired and displays only the sum of only active licenses. If all licenses for the feature are expired, License Statistics displays the sum of all licenses and the oldest expiration date. If there are still some active licenses for the expired feature, License Statistics displays a proper warning. See also