...
...
functionality that has been removed from License Statistics. Reports have been restructured and reorganized as of License Statistics v6.14. The contents of the Usage Per User report have been moved to Features - History - Usage Per User. |
The Usage Per User report under the Reports section in the left navigation pane shows license usage for a selected type of aggregation, as described below. In this report, you can change time constraints
...
To see a report on the usage of feature, select the Usage Per User tab from the Reports page.
General information
The Usage Per User report lets you monitor license usage for a user or a group of user, based on the selected type of aggregation to use for the report (described below). With this report you can change time constraints, as appropriate for your needs; for example, you can collect display license usage information based on a monthly basisusage, but limit the displayed results shown to weeks.
Types of aggregation
The Usage Per User report lets you specify the type of aggregation by which you can aggregate the results for the report. If the aggregation type is not specified, the report will be aggregated by Username and Hostname. Available options are:
...
may serve as a warning signal, letting you see whether higher usage is a one-time or a recurring event based on overall trends of license usage based on peak usage.
Types of aggregation
You can aggregate report results by:
By default, reports are aggregated by Username and Hostname.
| Info |
|---|
| If the User Group and/or Host Group options are disabled, this indicates that no groups have been created. |
How aggregation is applied in a report
Aggregation is the process of consolidating multiple records into a single record. For example, license Aggregation enables you to specify detailed levels of the produced results. License usage information can be collected on a daily basis and aggregated into a value for the week, the weekly usage information can be aggregated into a value for the month, and so on.
Example
Let's look at the following diagram to better understand how the selected type of aggregation affects the results shown in a report. In our example we have selected to show feature usage information for a particular User Group.
 Image Removed
Grouping feature usage information
displayed for a specified entity, letting you juxtapose one set of data with another.
| Expand |
|---|
|
The following diagram shows how License Statistics aggregation options are used by real-world entities in a company.
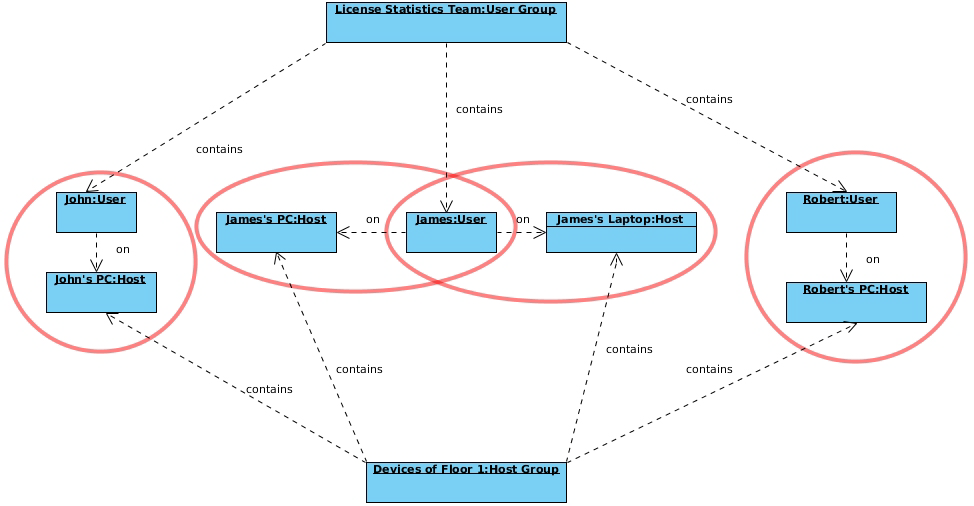 Image Added Image Added
|
Date Range
The Start Date, End Date, and Time Interval fields are interrelated; e.g., modifying the Start Date field affects the End Date field, depending on the selected Time Interval option. Selecting the "Custom" Time Interval option lets you specify the Start Date and End Date for the report.
Types of grouping (time units)
You Depending on your needs, you can group feature usage information by the following units of time:
How grouping by a unit of time works in a report
Grouping by a unit of time lets you group values from specified fields together, providing a single record of, thereby providing a single record of values for each group.. For example, license usage information can be limited to a month, and within that month displayed based on daily usage. Grouping works in the same way for all other available time units, for any set of selected values.
| Expand |
|---|
|
Let's assume the following values have been returned after grouping feature usage information by |
...
...
...
...
...
...
...
...
...
...
When we choose to group the above feature usage information by Month and set the start date to April 4, 2014, we obtain the following values: |
...
...
When we decide to set the start date to April 1, 2014, we get the following values: |
...
...
Grouping works in the same way for all other available time units, for any set of selected values.
The minimum value you can group by is Day. As in the case with aggregation values, the values of columns grouped by other available options are calculated based on calculations of values set for Day for a particular aggregation.
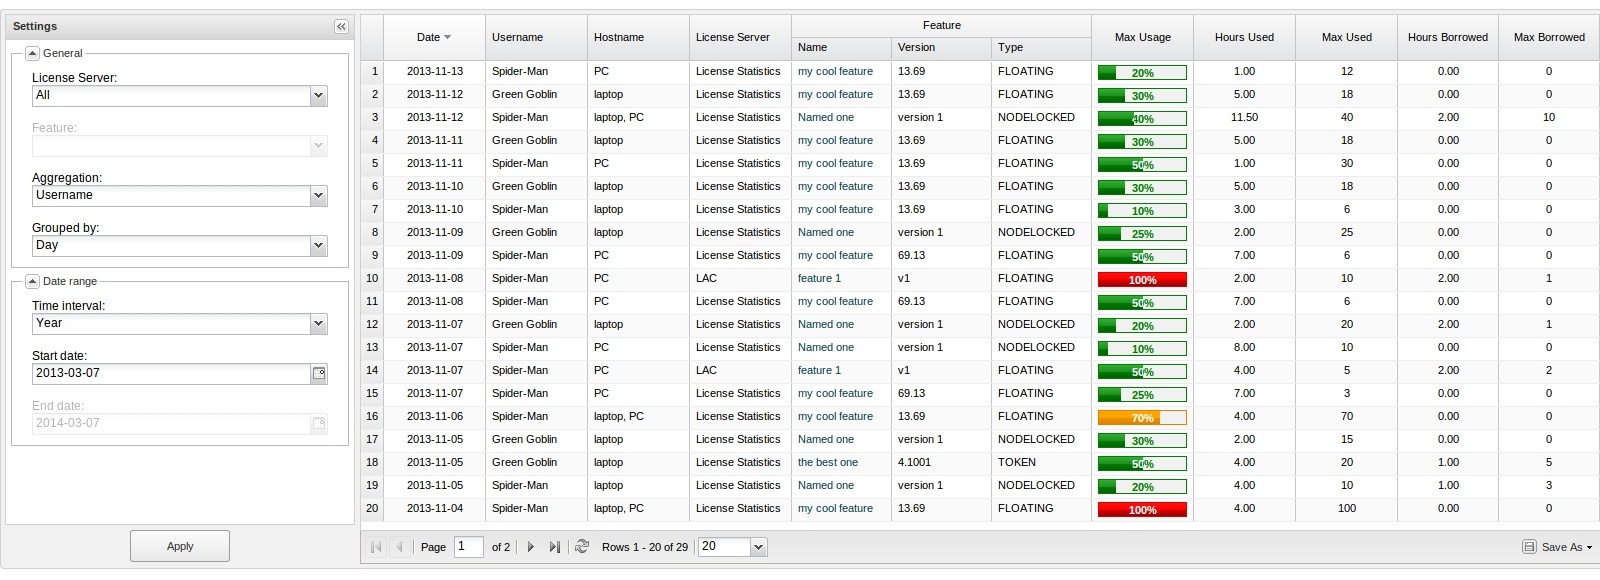 Image Removed
Feature Usage Information
You can see a list of hostnames/usernames included in the existing Hostnames/Usernames columns when aggregating by a particular aggregation option, and to maintain the visibility of Username/Hostname columns when aggregating by a different aggregation option.
Usage Per User grid
The Usage Per User grid The feature usage information includes the following:
| Column Name | Description |
|---|
| Date | A particular day or period of time, whose format depends on the selected grouping option. Day: YYYY-MM-DD; for example,
|
2014..-13. Week: YYYY-MM-DD - YYYY-MM-DD; for example,
|
2013.11.10 - 2013.11.2019-04-10 - 2019-04-16 (starts from
|
SundayFriday). Month: YYYY-MM; for example,
|
2014.2019-04. - Quarter: YYYY-Q[1-4]; for example,
|
2014-01.| Hours Used | The number of hours at least one license of a particular feature was used and/or borrowed. |
Hours Borrowed | - 2019-Q2.
- Year: YYYY; for example, 2019.
|
| User | A single user or a list of users. |
| Host | A single host or a list of hosts where license usage took place. |
| Host IP | IP address for the host. |
User Group
| The name of a group of users. (This column will be displayed only if aggregating by User Group and one or more user groups exist.)
|
Host Group
| The name of a group of hosts. (This column will be displayed only if aggregating by Host Group and one or more host groups exist.)
|
License server and
feature information | License server name and feature name, version and type. |
| Max Usage | The maximum allowed level of feature usage, expressed in percentages. |
| Hours Used | The sum of hours when licenses of a particular feature were |
The number of hours at least one license of a particular feature was | used and/or borrowed. |
| Max Used | The maximum number of licenses used in a particular time period. |
| Hours Borrowed | The sum of hours when licenses of a particular feature were borrowed. |
| Max Borrowed | The maximum number of licenses borrowed in a particular time period. |
Max Usage | The maximum allowed level of feature usage, expressed in percentages.
| Expand |
|---|
|
To better understand |
...
possible aggregation scenarios |
...
, let’s look at the following example: | Column | Aggregation Type | Scenario |
|---|
|
...
...
| Username | In our example, the results shown in the report are limited by Day. |
|
...
Scenario 1 The user uses 1 license for 8 hours. Calculation: 8 hours = 8 Hours Used |
|
...
...
The user uses 2 licenses for 1 hour, then 10 licenses for 2 hours and 1 license for 2 hours. Calculation: |
|
...
...
...
...
When you choose to use a different aggregation type or when you decide to group by a different value, the sum of the values will be displayed for the following:
a). Days in a time frame
...
...
...
this example, the results shown in the report are limited by Day. |
|
...
Scenario 1 The user uses 2 licenses |
|
...
in the same time during the day. |
|
...
Calculation: 2 licenses in the same time = 2 Max Used/Borrowed Scenario 2 |
|
...
...
1 license for an hour in the morning and 1 license for an hour in the afternoon.
Calculation: 1 license in the same time = 1 Max Used/Borrowed Scenario 3
The user uses 1 license constantly for the entire day, while the other |
|
...
one is used only for 1 hour.
Calculation: 2 licenses in the same time = 2 Max Used/Borrowed |
|
...
...
...
| Username | In our example, the number of available licenses for a particular feature is 10. |
|
...
Scenario 1 The user uses 2 licenses throughout the day. |
|
...
Calculation: 2 licenses out of 10 licenses = 20% |
|
...
Scenario 2 The user uses 5 licenses |
|
...
constantly for the entire day, |
|
...
except 1 hour when only 2 licenses are used |
|
...
...
Calculation: 5 licenses out of 10 licenses = 50% |
|
...
Scenario 3 The user uses 3 licenses |
|
...
constantly for the entire day, but |
|
...
additionally 5 licenses are used for |
|
...
2 hours.
Calculation: 8 licenses out of 10 licenses = 80% |
|
...
When you choose to use a different aggregation type or when you decide to group by a different value, the same method of calculation will be applied.
...