...
The information on this page refers to License Statistics v6.14 15 and newer, which reorganized reportschanged the behavior of hovering over Features page graphs. If you are using a version previous to v6.1415, see Removed Features. Also note that for a limited time, the old menu structure in the License Statistics UI will be retained, so if you cannot locate what you're looking for with the new menu structure, you can try locating it using the old structure documentation for previous versions. |
The graphs in the Features pages give you a visual picture of your license utilization. Points on the graphs indicate the number of licenses used during the indicated time period.
General use of graphs in the Features pages is covered below.
Viewing
...
details in Feature page graphs
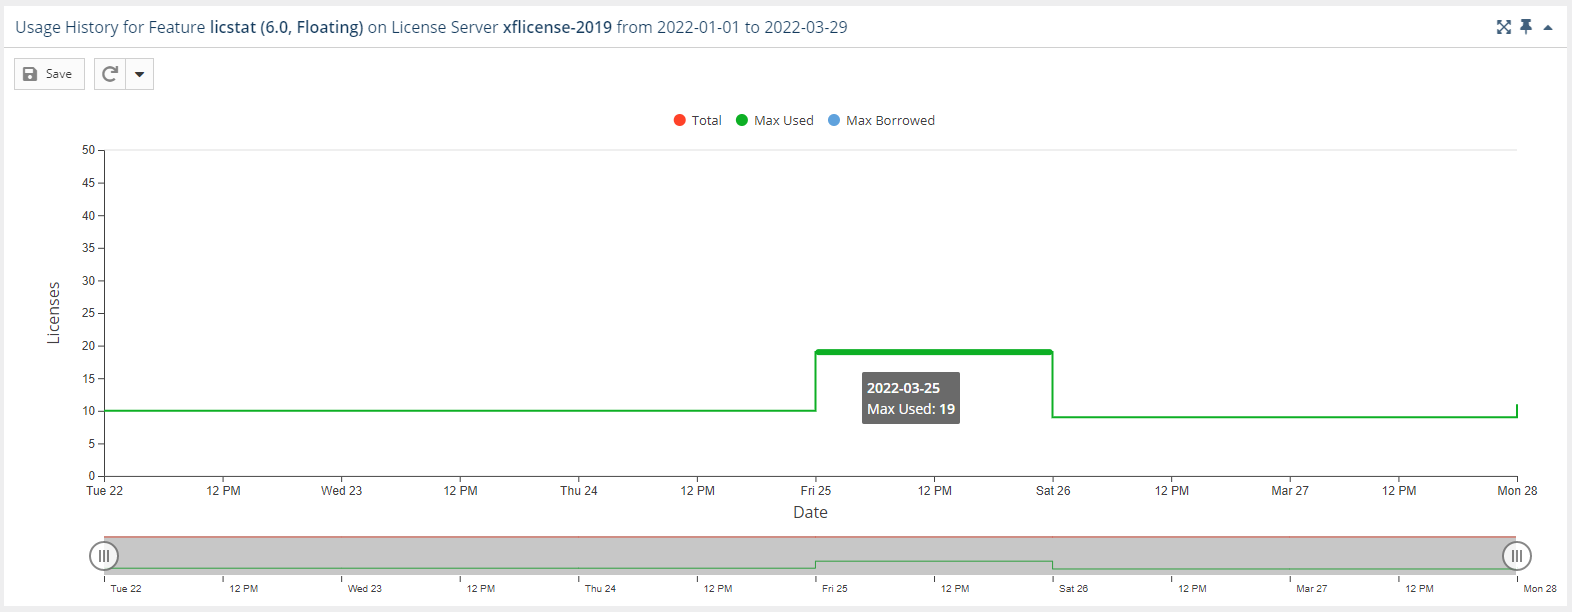
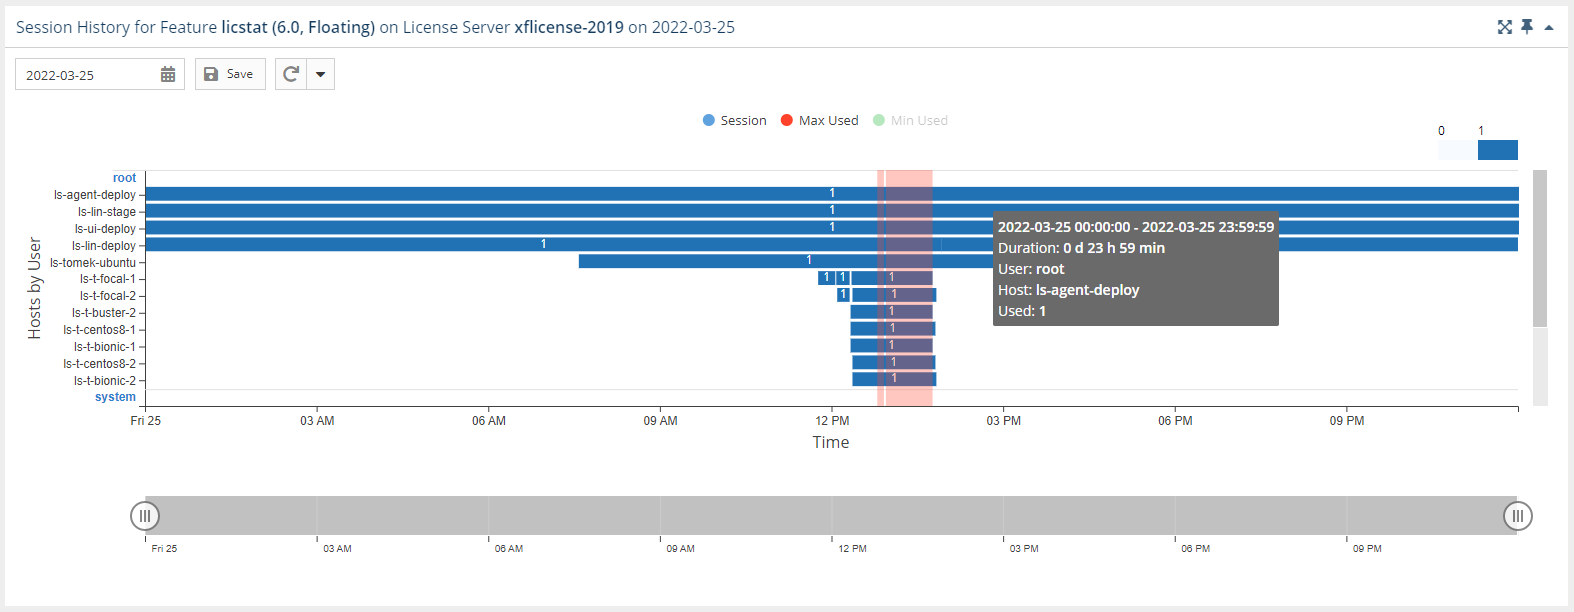
For Sessions and Usage graphs, tooltips show the precise hovering over the graph will display a labeled list that shows the following information (as applicable to the data being reported):
- date and time
- number of available, used, and borrowed licenses
...
- time of usage (for graphs that report time)
The appearance of this information is illustrated in the Feature Usage History and Feature Session History examples below.
 at any point in the graph.
Hiding or showing the display of selected usage details on the graph
...