...
The Settings area lets you choose the time interval (Year, Quarter, Month, Week or Day), date, and time range to include in the results.
By default, utilization includes only the time that License Statistics and the monitored server were up. You can choose to include downtime in the results (in both the chart and the grid) by toggling the "Include downtime" checkbox.
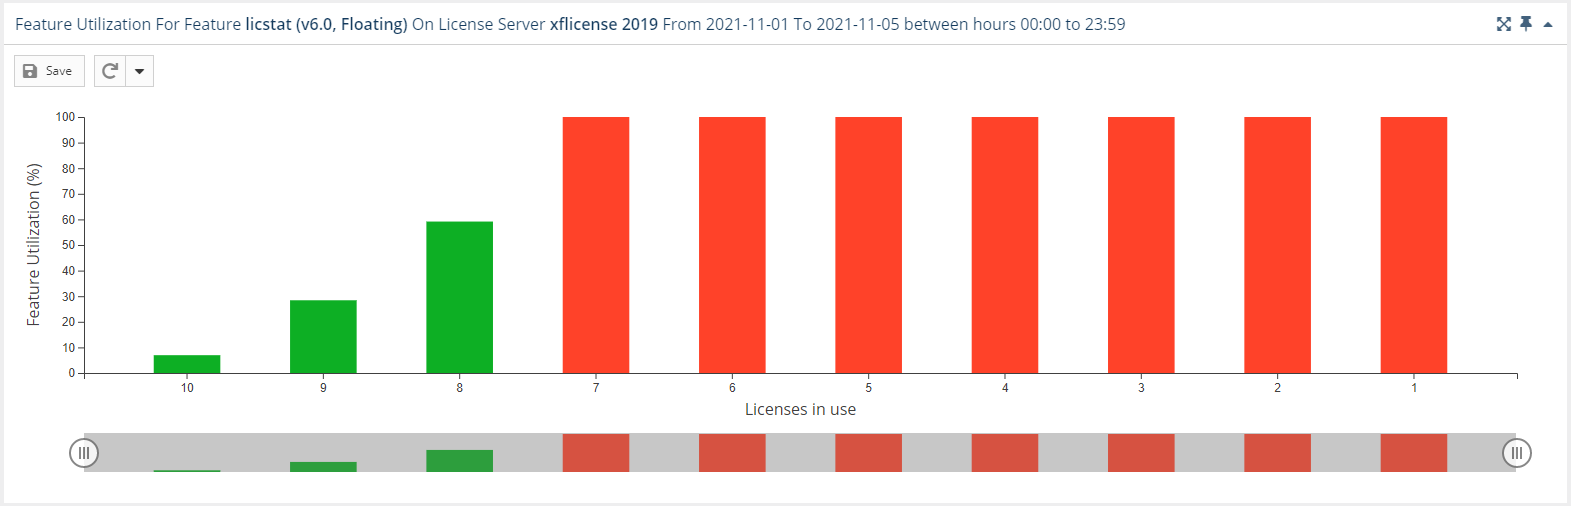
Feature Utilization graph
The Feature Utilization graph gives you a visual picture of the license utilization trend throughout a specific period of time. You can also select to view utilization based on hours (in both the table and the graph), by selecting the From hour/To hour times you wish to view from the Settings panel on the left-hand side of the grid. (For additional information about feature graphs, see General use of feature usage graphs.)
As shown in the example below, the amount of utilization drops consistently with the number of simultaneously used licenses.
You can add the Utilization History graph to the License Statistics Dashboard. Learn more about customizing the Dashboard.
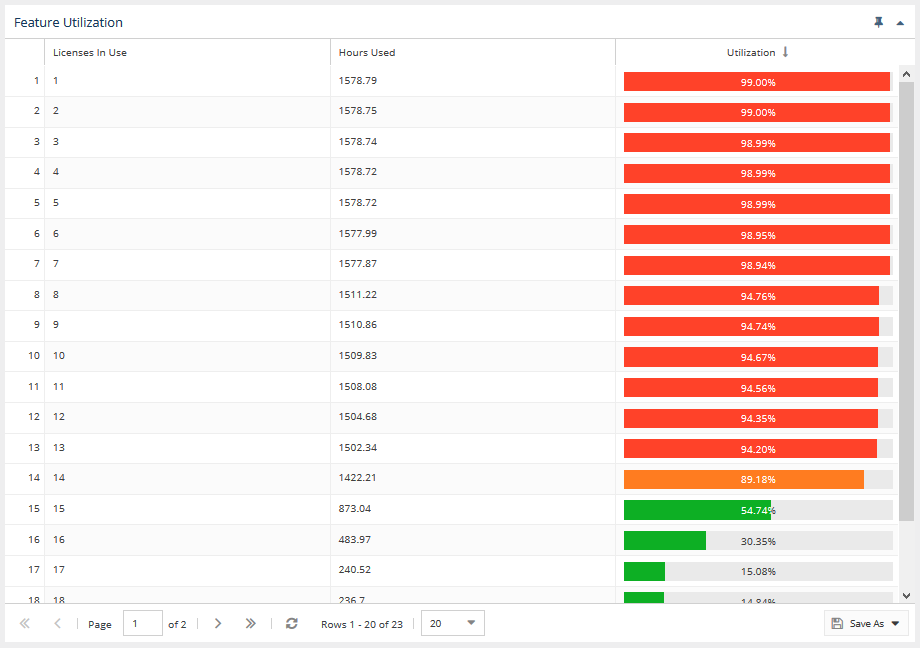
Feature Utilization grid
The Feature Utilization grid shows license usage based on how many licenses were used for how long and the percentage of utilization for those licenses.
NEW SCREENSHOT NEEDED TO REFLECT CHANGED/ADDED COLUMNS
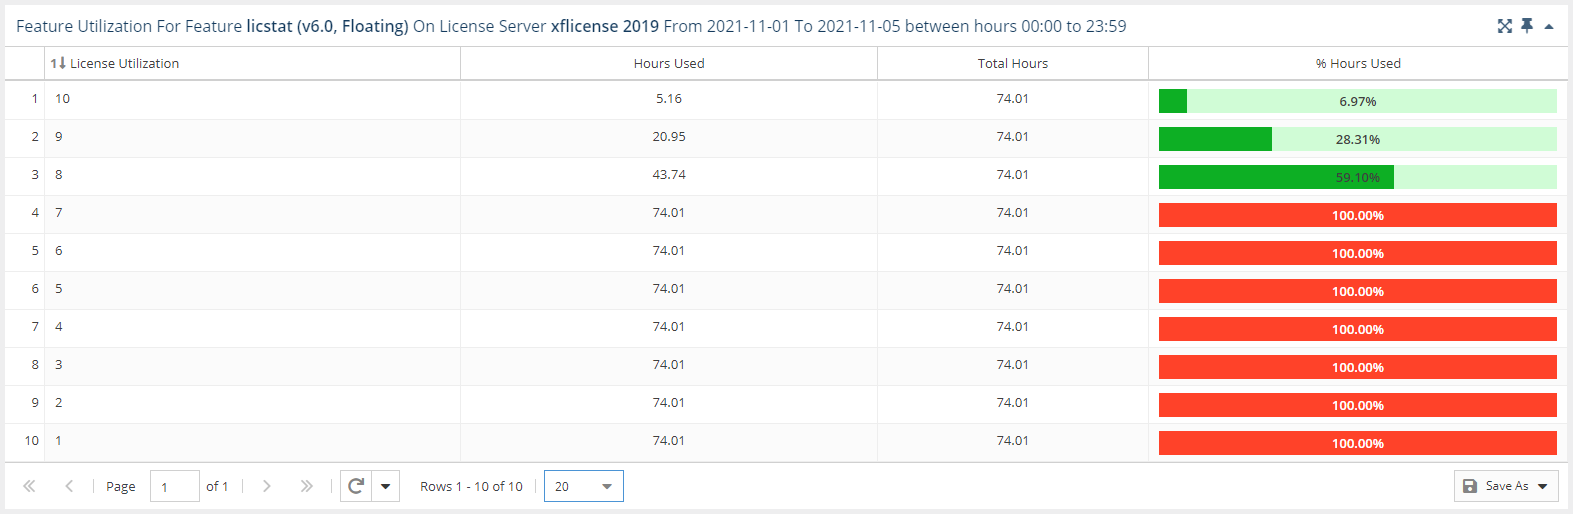
The calculation for determining the percentage of utilization hours used is as follows:
Utilization Percentage of hours used = 100 * number of hours for which a specific number of simultaneously running licenses were used / hours monitored
...
100 * 160 / 615 = 26.0%
where
The precise utilization percentage calculation may be slightly different than 26%, because the license server may be down for short times during the month (by default the Include downtime checkbox is unchecked so downtime is not shown on the utilization history graph).
You can add the Utilization History grid to the License Statistics Dashboard. Learn more about customizing the Dashboard.
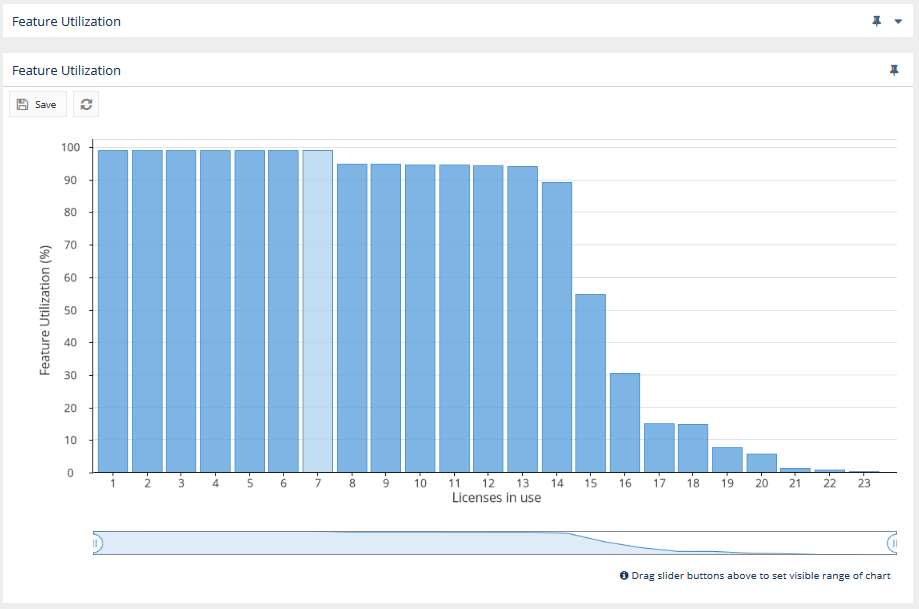
Feature Utilization graph
The Feature Utilization graph gives you a visual picture of the license utilization trend throughout a specific period of time. You can also select to view utilization based on hours (in both the table and the graph), by selecting the From hour/To hour times you wish to view from the Settings panel on the left-hand side of the grid. (For additional information about feature graphs, see General use of feature usage graphs.)
As shown in the example below, the amount of utilization drops consistently with the number of simultaneously used licenses.
...
to the License Statistics Dashboard. Learn more about customizing the Dashboard.