...
| The information on this page refers to License Statistics v6.6 9 or newer, which introduced a new License Usage History chartHarvesting. If If you are using an earlier version, please refer to the documentation for earlier versions. |
...
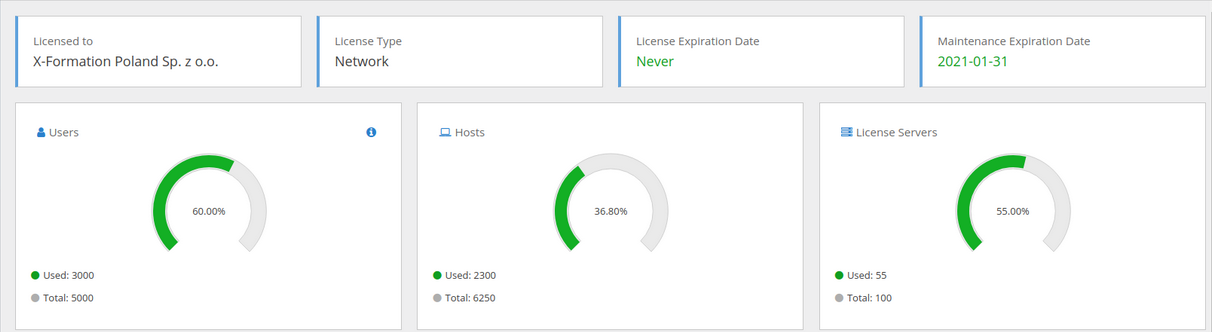
When license usage is within your license limits, the License Details graphs will be green, as illustrated below.
 sof
sof
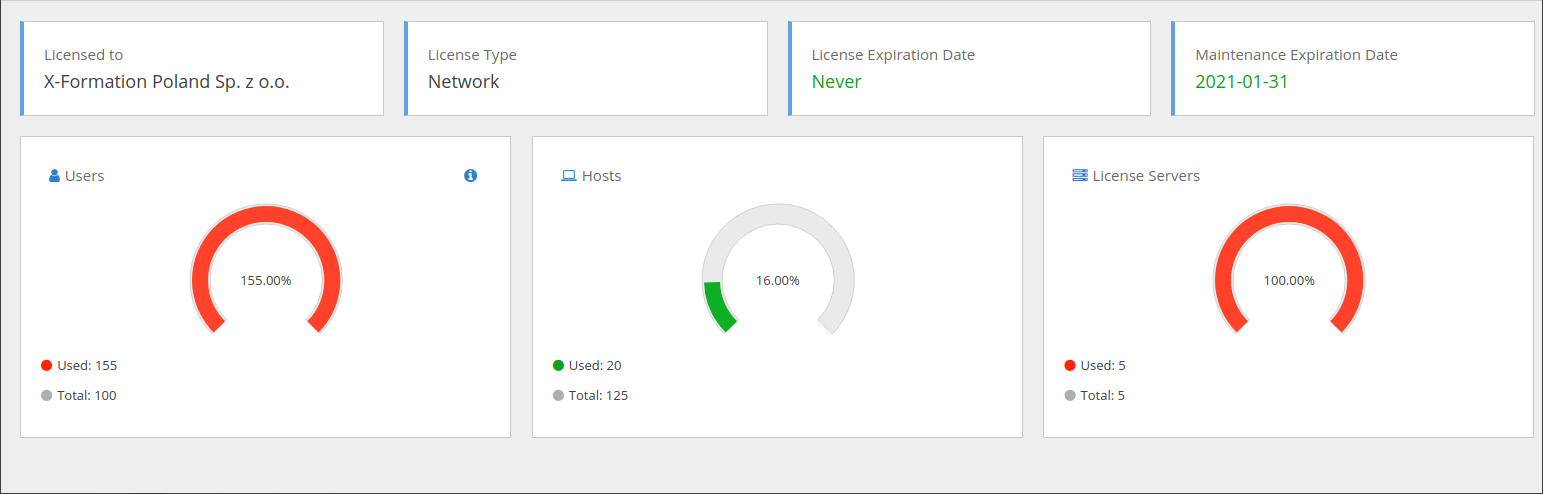
You can easily see when your license limits are exceeded or nearing threshold (90% and above), indicated by red in the License Details graphs, as illustrated below.
The Hosts gauge reports the number of hosts monitored for the entire database. The Total value is 125% of the Users gauge's Total value, which is the threshold unless a High Performance Computing (HPC) license is being used.
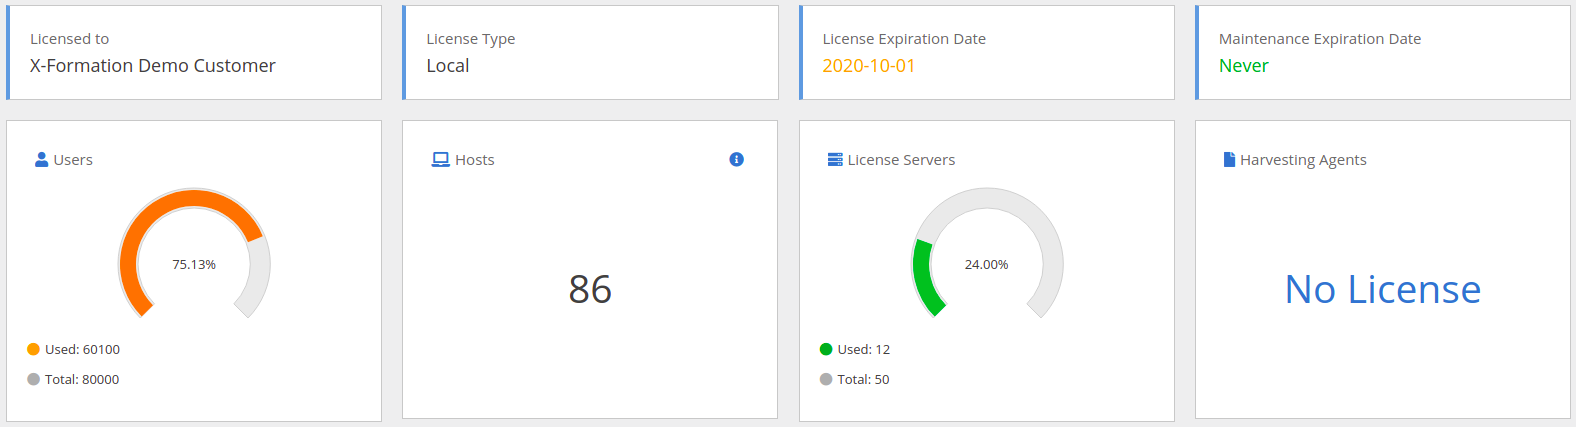
If an HPC license is in use, the threshold on allowed number of Hosts is lifted, and the Hosts information will look similar to the following illustration.
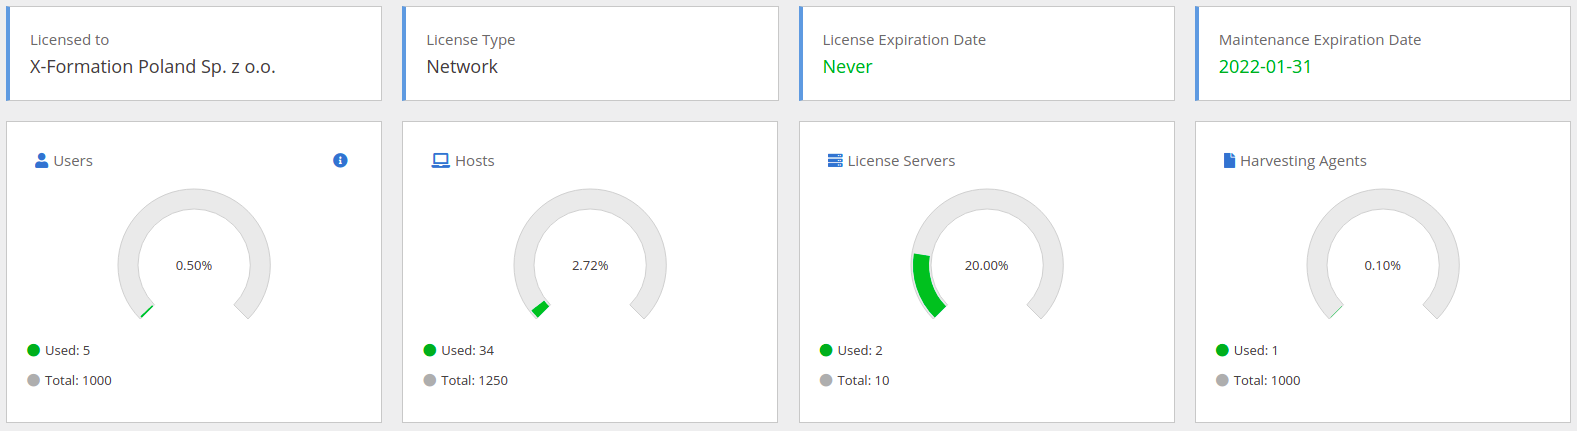
If there are no Harvesting Agents included in the license, the information will look similar to the following illustration.

| Info |
|---|
For the old licensing model:
|
...
The License Usage History chart reports historical usage of the License Statistics license.

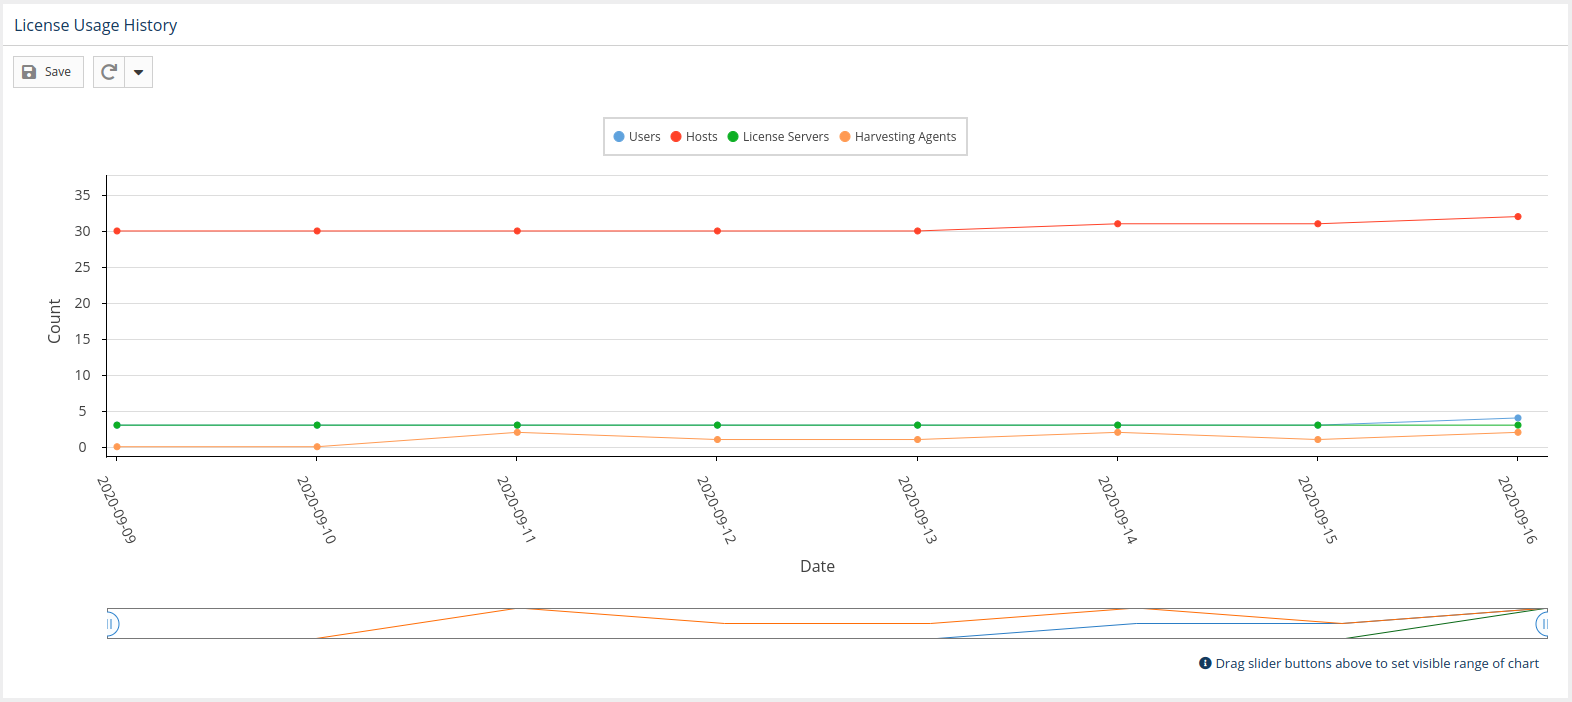
The information shown in this chart is dependent on your licensing type, as described below.
...
- Users: number of all users in database until the date
- Hosts: number of all hosts in database until the date
- License Servers: number of maximum concurrent license servers in each day
- Harvesting Agents: number of License Harvesting Agents in each day
Old licensing model (2013)
...