The information on this page refers to License Statistics |
6. |
0 and newer, which |
introduced a new user interface (UI). If you are using |
a version previous to v6.0, see documentation for previous versions. |
To see a report on expiring features, select the Expiring Features tab from page under the Reports pagesection in the left navigation pane.
By default, the Expiring Features grid shows all expiring features, but you can select the server for which you want to . You can see expiring features for a specific license server by selecting it from the Select License Server pick list at the top of the gridpage.
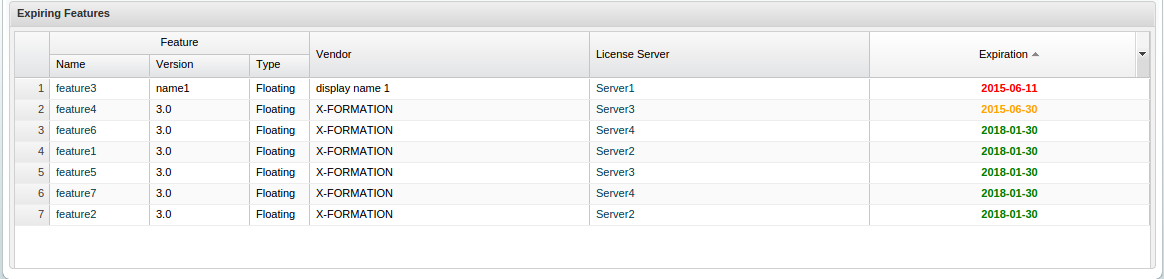
The Expiring Features report shows feature details (name, version and type), the vendor of the monitored software and the license server and expiration date for those features.
You can add the Expiring Features report grid and chart to the License Statistics Dashboard. Learn more about customizing the Dashboard.
The color of the text in the Expiration column helps you quickly recognize which licenses are expiring soonest:
- Red: expires in 0 - 7 days
- YellowOrange: expires in 8 - 30 days
- Green: expires in more than 30 days
You can add this grid to the Dashboard. 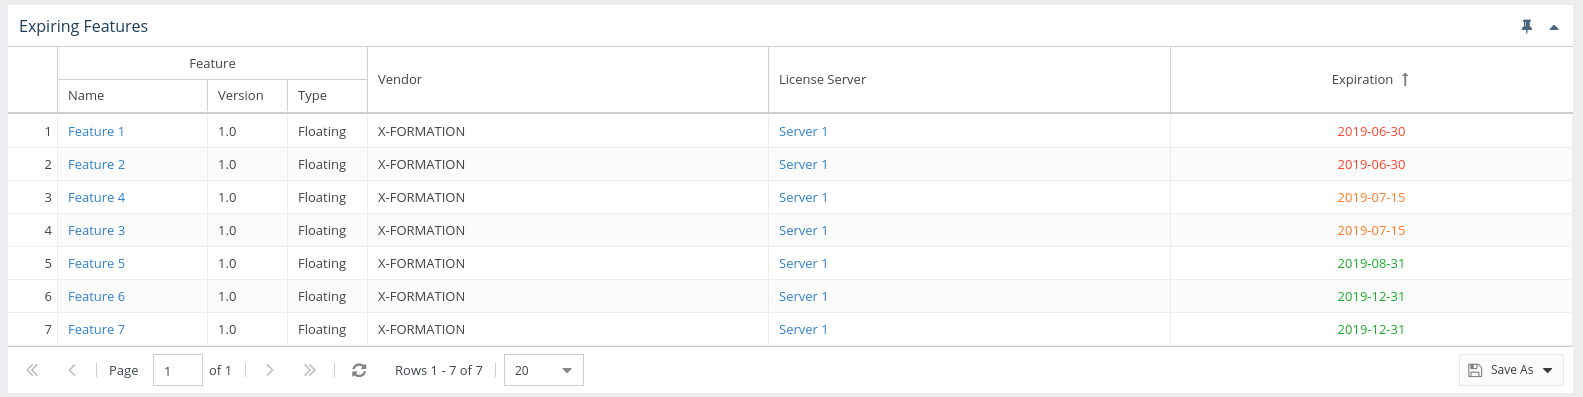
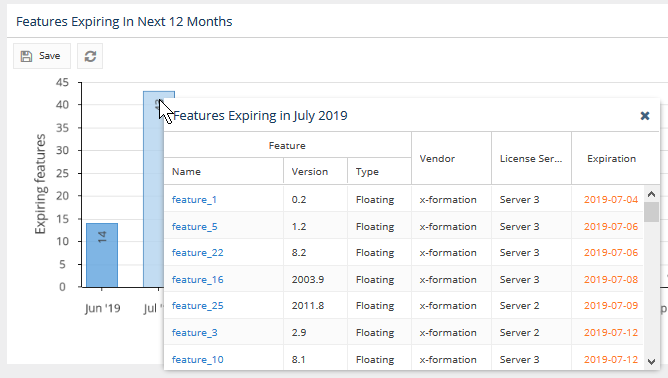
Features Expiring In Next 12 Months chart
The Features Expiring In Next 12 Months chart shows statistics about features expiring in the next that will expire within 12 months, letting keeping you stay informed about monitored licenses that will expire in the coming year , to help so that you can stay on top of license renewal times. You can click on hover over a specific month in the chart to view more information about a specific feature. The popup that appears shows the same feature-related information as you can find in the Expiring Features grid.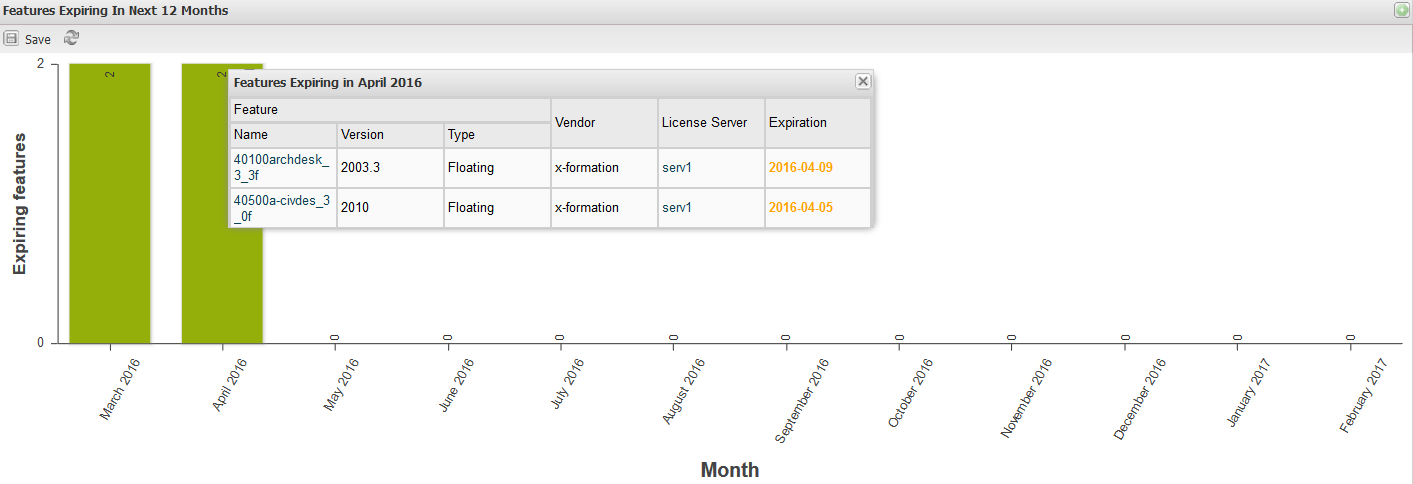
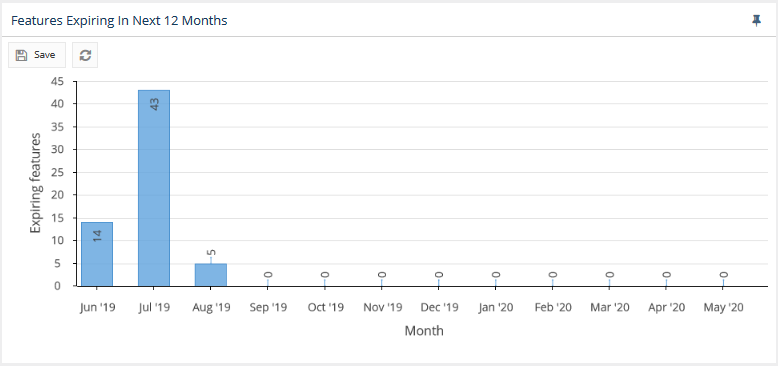
You can add this chart to the Dashboard. hover over a specific month in the chart to view more information about a specific feature. The popup that appears shows the same feature-related information as you can find in the Expiring Features grid.