...
The information on this page refers to License Statistics v7.0 4 and newer, which redesigned dashboardsintroduced the ability to add administrative reports to dashboards (available only for administrative-level users). If you are using a version previous to v7.04, see documentation for previous versions. |
You can customize dashboards by adding and removing report widgets, rearranging widgets for your preferred page layout, and controlling the display of your data. Dashboards are easy to customize, as described in the following sections.
...
- Navigate to the report you want to add. (See Reports you can add to dashboards, below, for a complete list of the reports you can add to a dashboard.)
- Make any desired settings to the report. The settings you make will be retained and visible after you add your report to a dashboard. You can:
- Apply filters and select the number of rows to display in the grid.
- Hide/show individual columns by selecting Columns and then toggling columns on/off as desired.
- Make additional settings using the Settings panel visible in some reports. - Click the Pin to Dashboard icon at the upper right of the grid/chart.

When you click the pin icon, you’ll be asked to select the dashboard to add the panel to. You can select any existing dashboard.

Adding a widget from the Dashboard page
...
- Select the dashboard you want to add a widget to from the Dashboards menu.
- Click Add Widget at the top of the page.
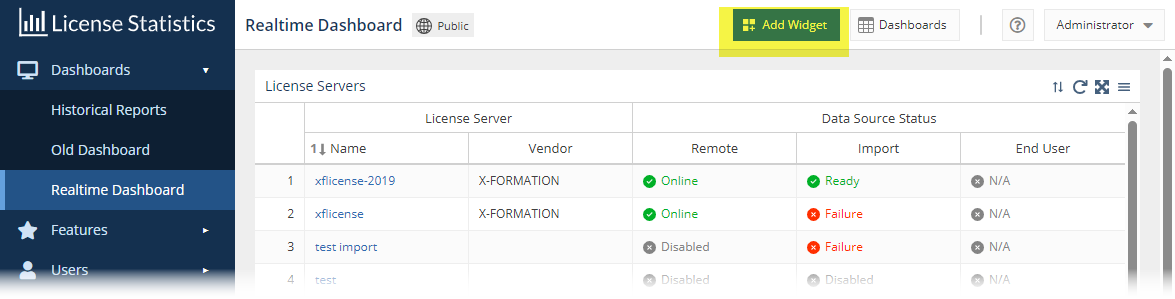

A dialog opens to let you select a widget to add to the selected dashboard. The Administration reports are available only for License Statistics administrative-level users.
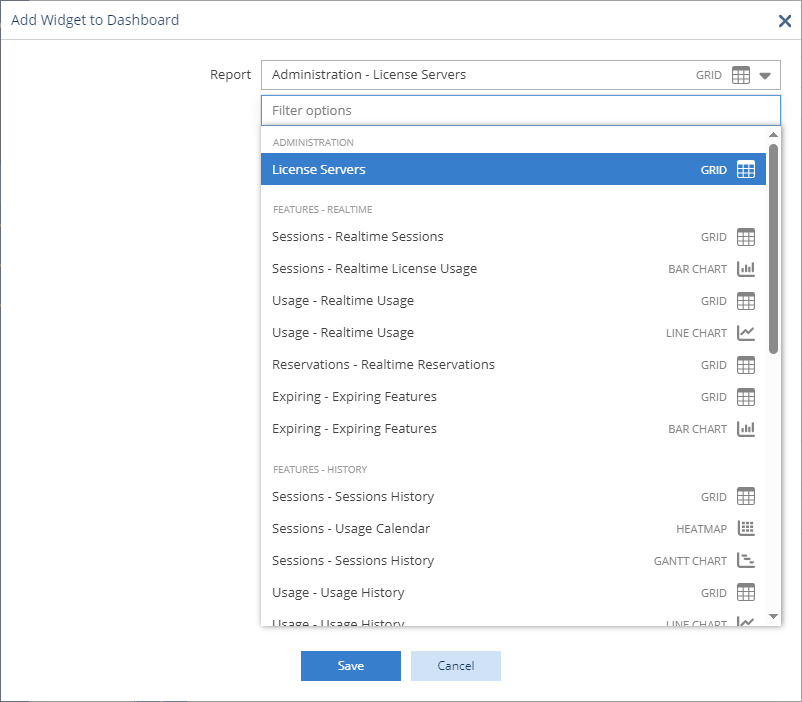

Depending on the widget type, the Add Widget to Dashboard dialog may let you select specific settings for the widget, as for the Usage per User widget shown in the illustration below.
...
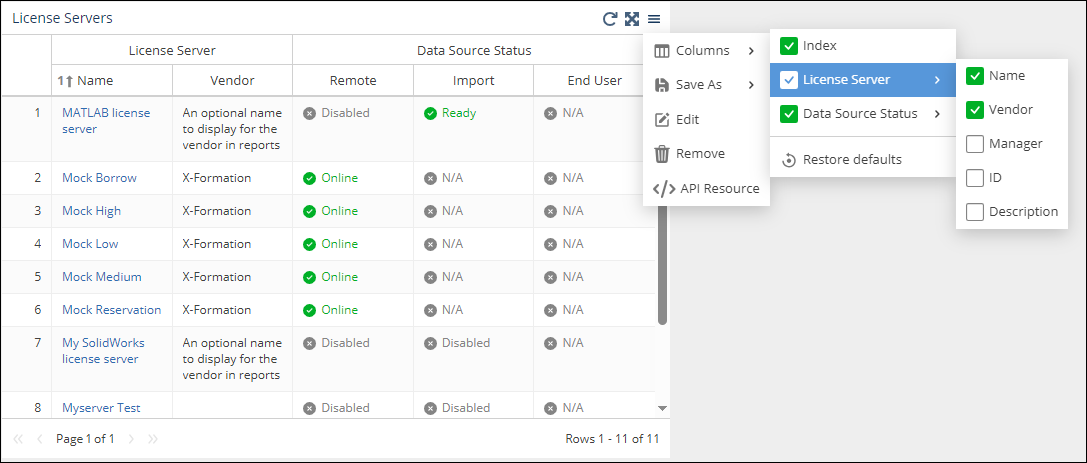
To remove widgets from a dashboard, click the "hamburger" Options icon in the upper right corner of the report, and then select "Remove" from the drop-down menu.
...
To hide or show columns, click the "hamburger" Options icon in the upper right corner of the report, and then select "Columns" from the drop-down menu. Check the columns you want see on the grid to be visible in the grid.

Changing report settings
To adjust report settings, click the "hamburger" Options icon in the upper right corner of the report, and then select "Edit" from the drop-down menu.
You can change the General settings for reports, including:
- titleTitle
- header Header color
- autoAuto-refresh interval
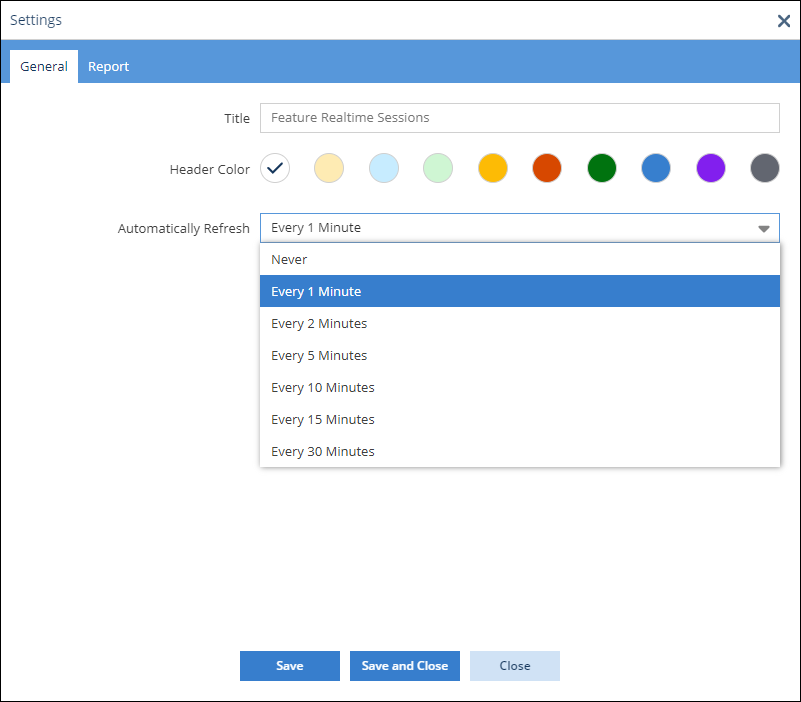
Some reports also include a Report tab that lets you change report-specific settings as applicable to the report, such as license server, feature, date range, etc.
...