...
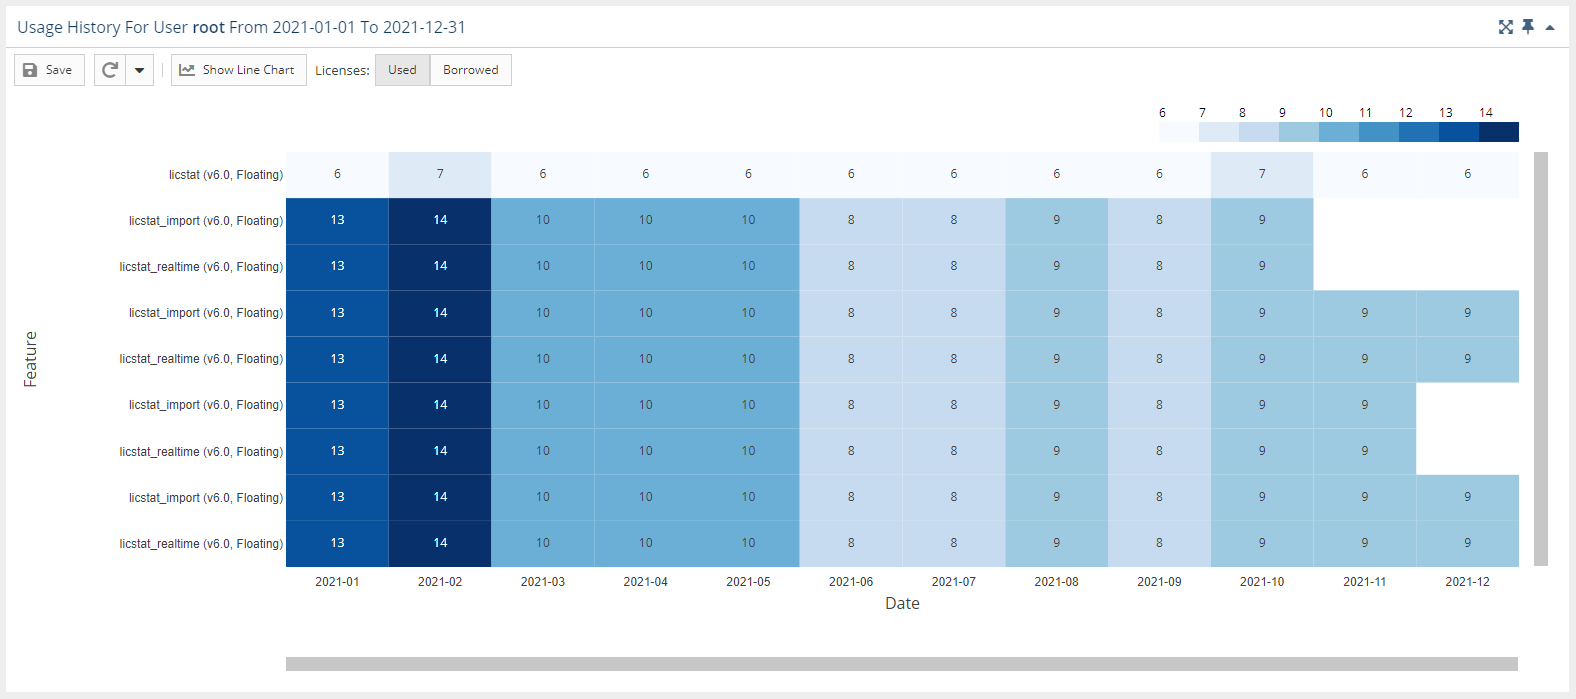
- You can toggle between used or borrowed licenses.
- The X axis reflects the grouping you selected in the Settings area at the top of the page.
- The Y axis contains list of all features that were used by the user or user group in the selected time range.
- The overlapping of the axes is the number of licenses used, with background coloring that corresponds with the scale.
- You can window an area in the chart to zoom into that area. After zooming into an area on the chart, you can return to the default zoom level using the Reset Zoom button at the top of the chart.
| Note |
|---|
There are technical limits above which the chart is not possible to render. It will not be visible when any of the conditions are met:
|