...
The top section of the Realtime Sessions report contains a Realtime License Usage graph that gives you a visual picture of the number of licenses currently in use, and by which users, giving you instant understanding of highest license usage per user.
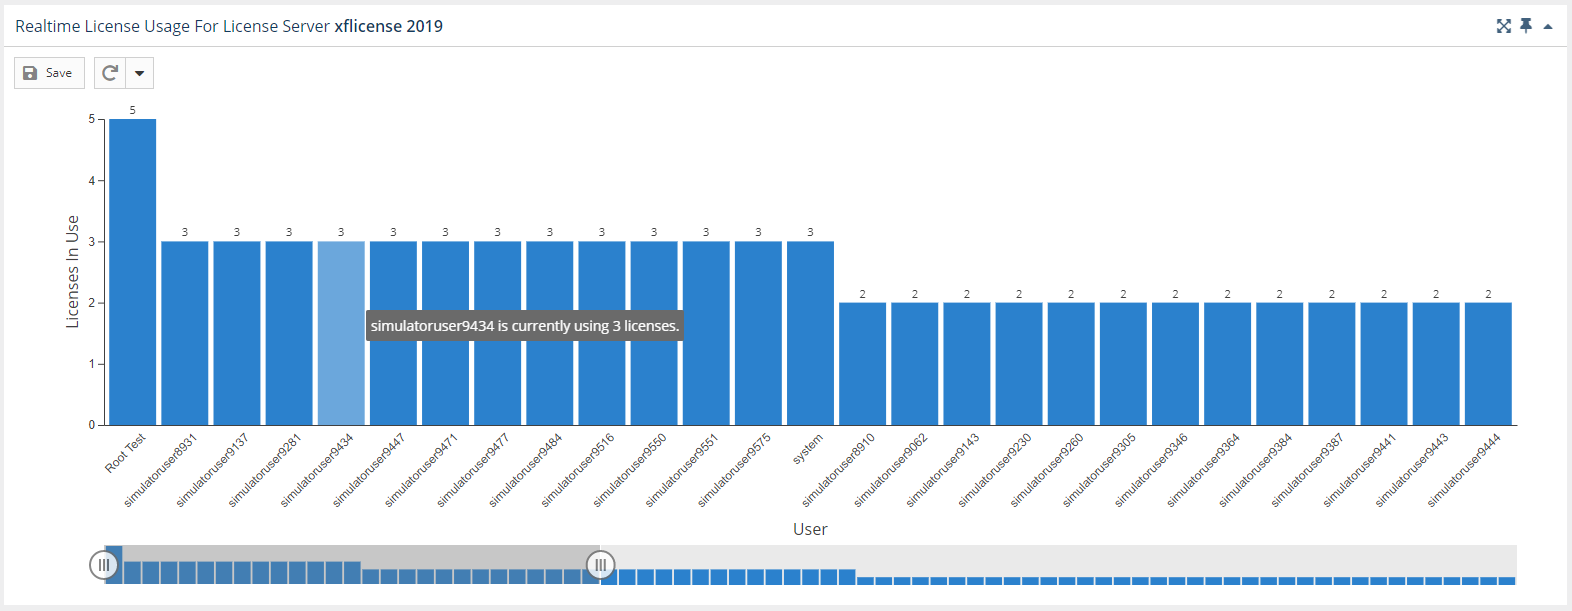
The slider at the bottom of the graph lets you restrict the results to the users you want to focus on (for example, you might use the slider to view only those users with more than 1 license in use).
If you select a license server/feature for which there is no realtime data, a popup with a link to view the history data for that license server/feature will appear in the upper right corner of the window.
...
The lower section of the Sessions report contains a Realtime Sessions grid. This grid shows current usage of all licenses for the selected feature.
The Current Feature Usage list grid includes the user and host (as well as host IP and host quantity, hidden by default) on which the selected feature is checked out, how many licenses that user has checked out, the checkout time(s) and how much time has elapsed since checkout, and for any borrowed licenses, when the borrow time expires.
...