To see a report that compares usage history, select the Usage History Comparison tab from the Reports page.
To view an existing Usage History Comparison report, simply select it from the Usage History Comparison drop-down list.
To create a new Usage History Comparison report:
- Select New Usage Comparison from the Usage History Comparison drop-down list.
- Select the desired features from the All Features grid and add them to the Feature On Comparison grid by clicking Add, and/or drag and drop individual features.
- As soon as you add one or more features to the Features On Comparison grid, a dialog opens to let you enter a name, which is required, and an optional description for the report. Click Save to create the report.
- After saving the report, you can add or remove features as needed by dragging and dropping them between grids or using the Add and Remove buttons.
To change the settings for the currently selected report:
- The Settings panel, on the left-hand side of the grid, lets you filter results by date range and group data by time period, as described for the Feature usage history page.
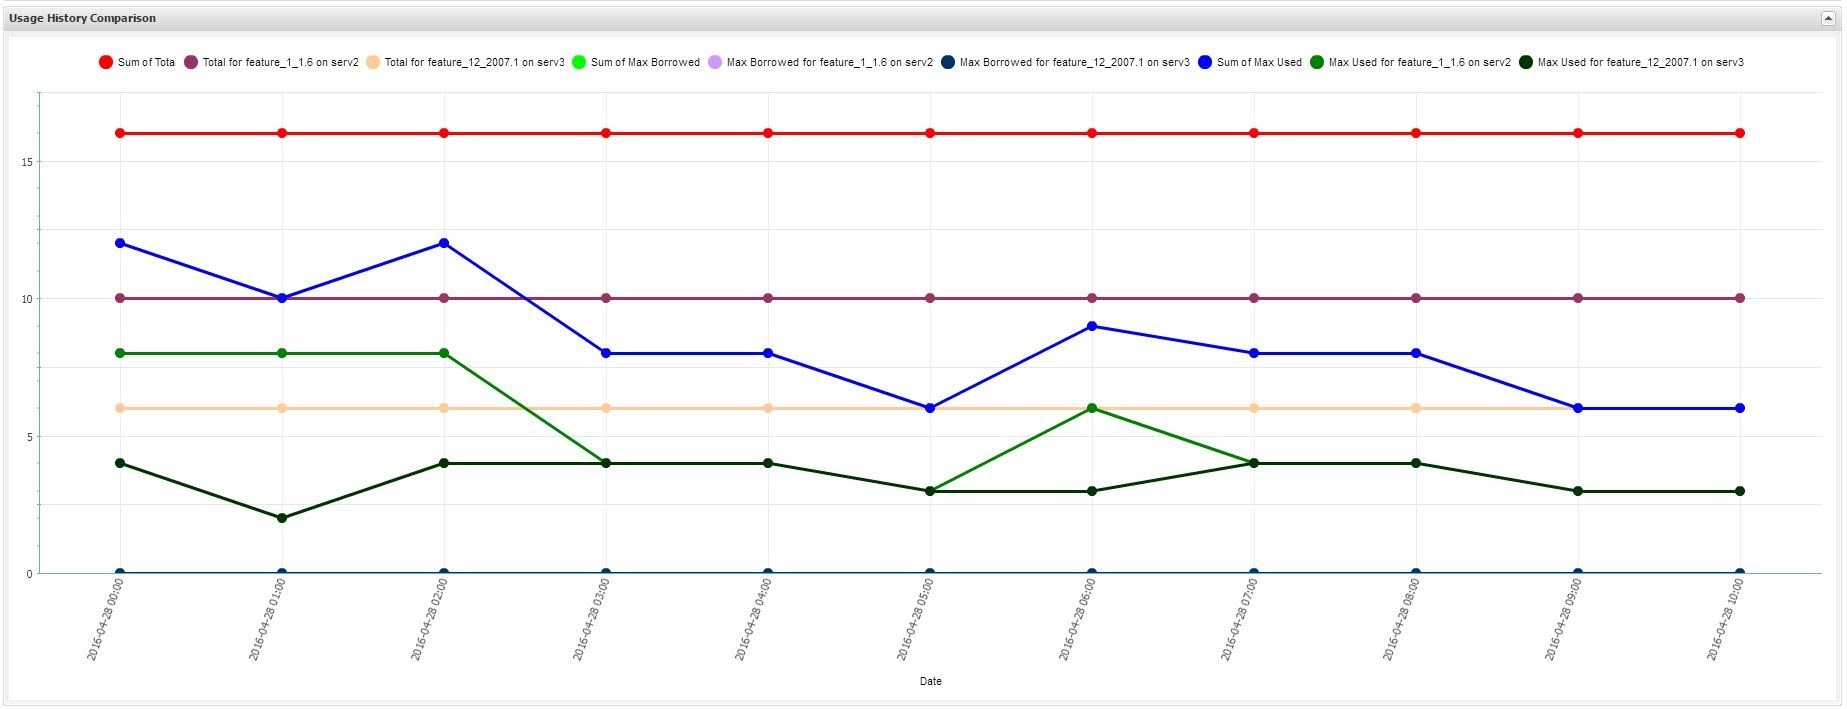
- You can choose to show or hide certain details in the report, such as borrowed licenses and average used licenses, by toggling them on/off. All options are toggled on by default.
The option, "Show aggregated usage data on the graph", displays an extra line with the sum for all features (one each for total, average, borrowed and used licenses), as shown below.
- To update both the grid and graph with the new settings, click Apply.
Exporting to external formats:
The Usage History Comparison grid can be exported to external formats CSV, XLSX or PDF) in the same way as other grids, as described in Downloading License Statistics data. In addition, you can export the data for the chart to these same formats or to PNG format using the Save button in the upper left corner of the chart. Note that only the PNG option exports the chart image; the other formats export only the data used to generate the report.