The graphs in the Features pages give you a visual picture of your license utilization. Points on the graph indicate the number of licenses used during the indicated time period.
Viewing number of licenses
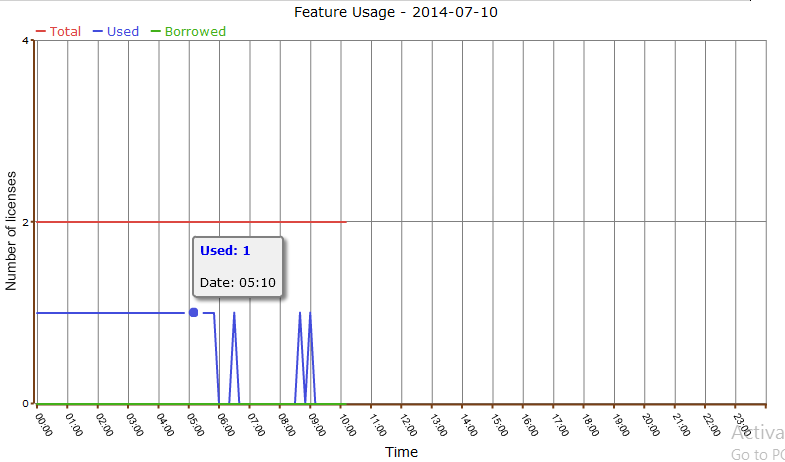
For Current Usage and Feature Usage History graphs, tooltips show the precise number of available, used, and borrowed licenses, as well as the time of usage at any point in the graph. The example below shows the Feature Usage graph from the Current Usage report.
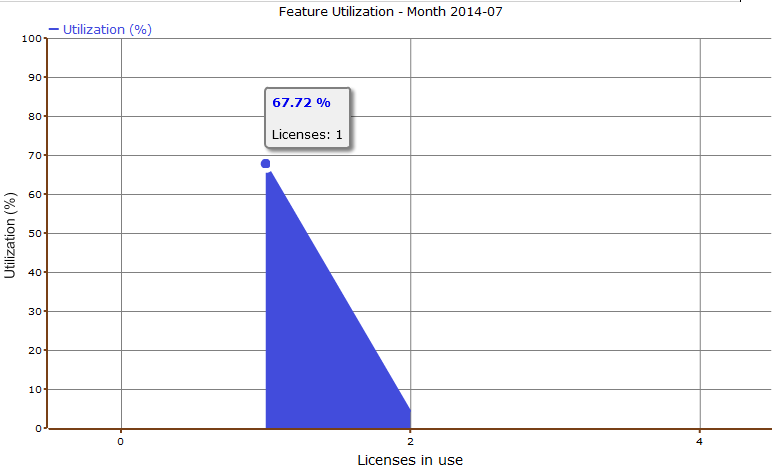
For the Feature Utilization History graph, tooltips show the precise percentage and number of used licenses.
Toggling license usage detail display on/off
For the Current Usage graph, you can select to hide or show the display of total licenses in the Advanced Filtering area, as shown below.

Toggling off the "Show total licenses on the graph" box will remove the "Number of licenses" lines from the graph. This can be useful if the license usage is relatively low, because it can make the graph lines easier to read, as shown in the examples below.
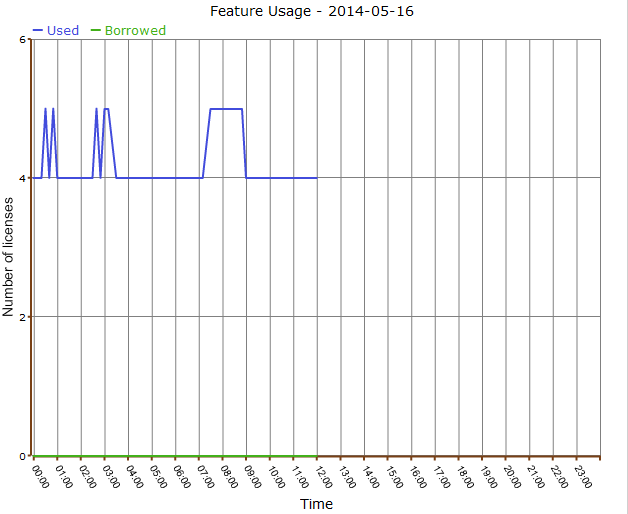
The following graph has total license display toggled on.
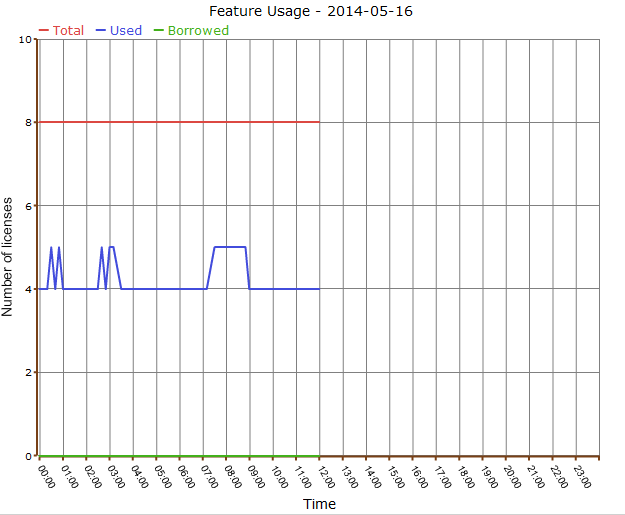
The following graph has total license display toggled off.
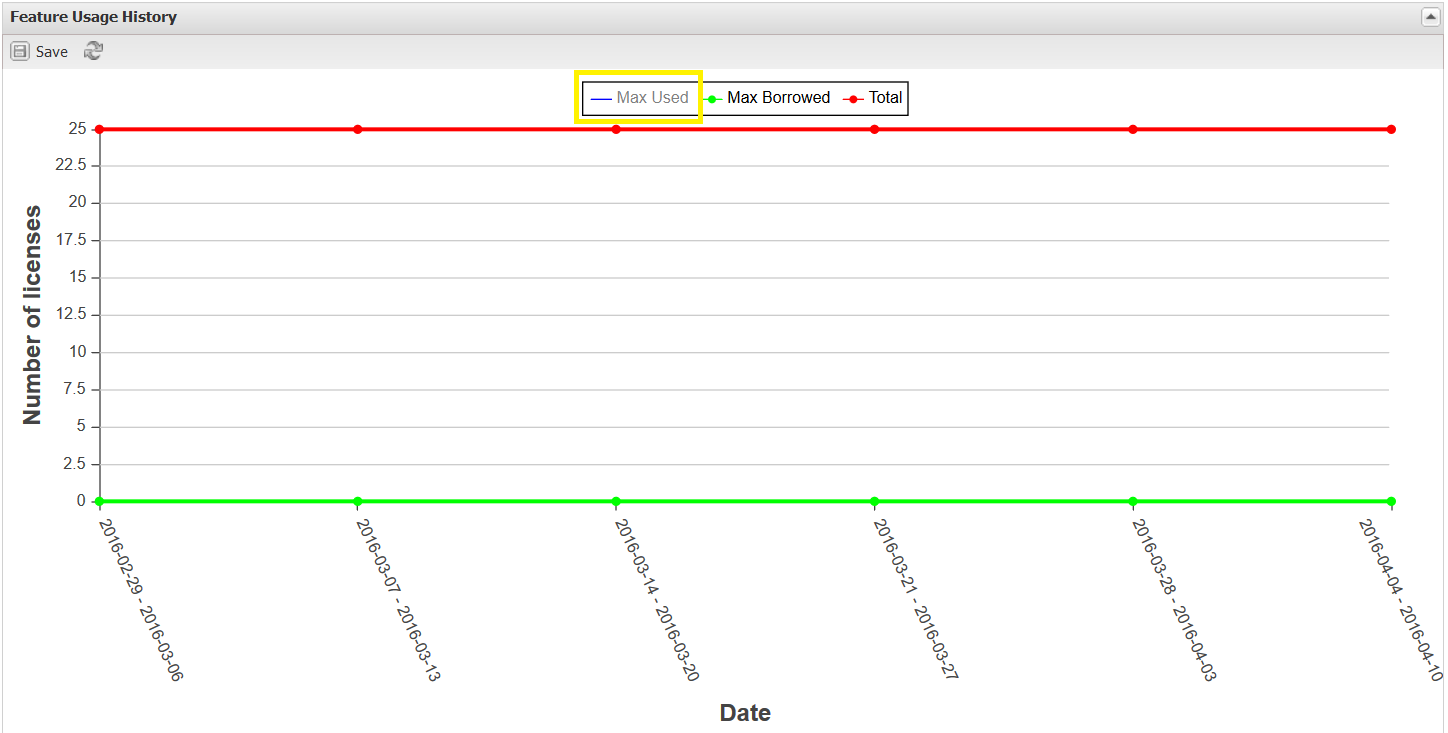
In the Feature Usage History graph, you can additionally hide or show used and borrowed licenses. The display of these usage details in the graphs is controlled by clicking the status for which you want to view data in the legend at the top of the chart. For example, toggling off the used license display on the graph legend will remove the lines showing the number of used licenses. The graph below shows the number of borrowed and total licenses and the display of used licenses is hidden (greyed out).