The graphs in the Features pages give you a visual picture of your license utilization. Points on the graph graphs indicate the number of licenses used during the indicated time period.
...
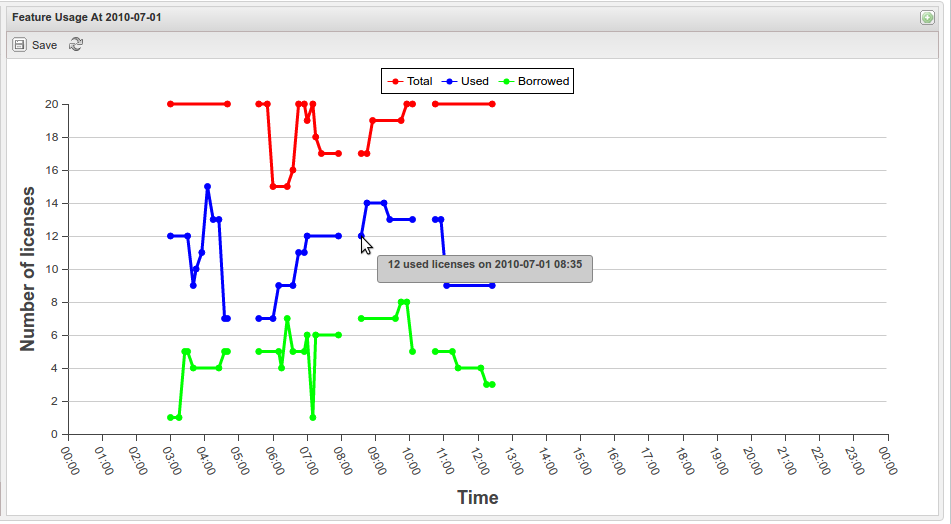
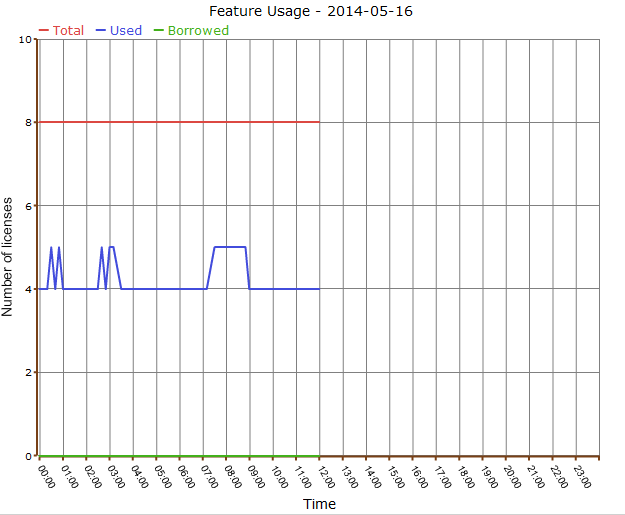
For Current Usage and Feature Usage History graphs, tooltips show the precise number of available, used, and borrowed licenses, as well as the time of usage at any point in the graph. The example below shows the Feature Usage graph from the Current Usage report.
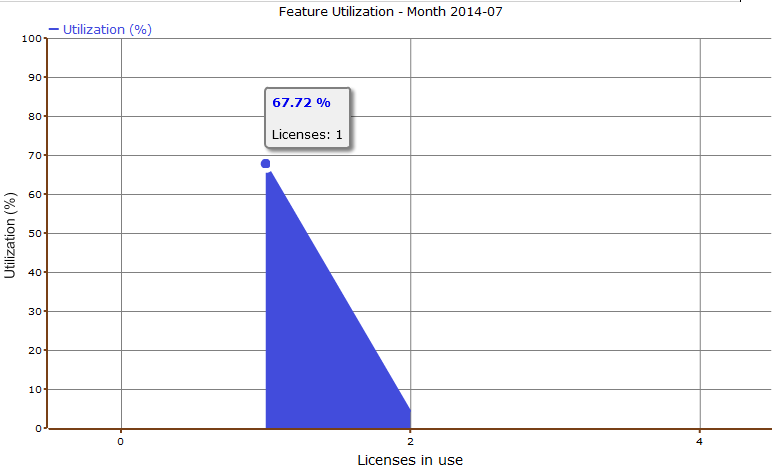
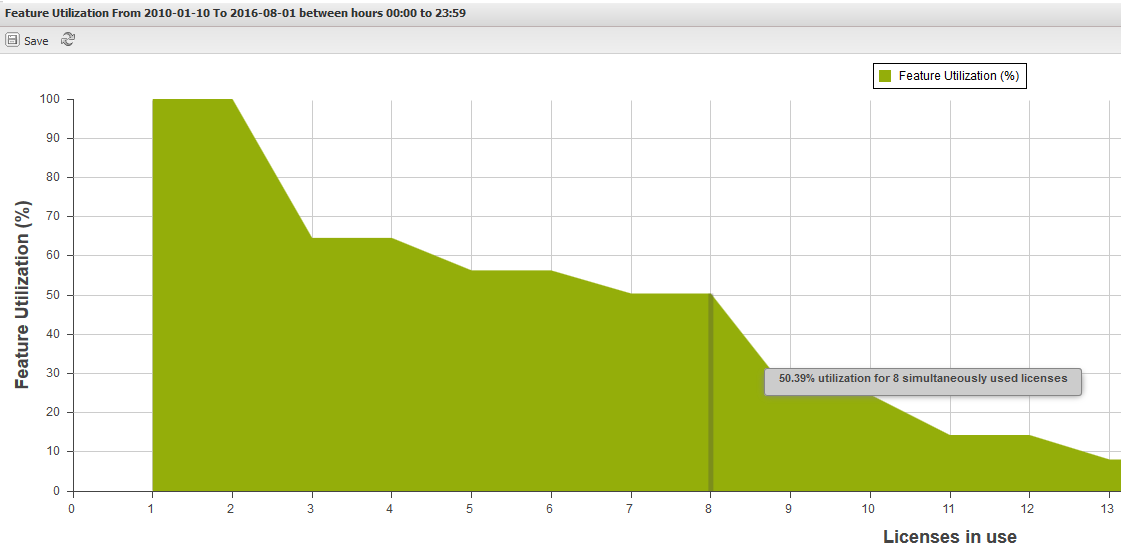
For the Feature Utilization History graph, tooltips show the precise percentage and of utilization of a given number of simultaneously used licenses.
Toggling license usage detail display on/off
For the Current Usage graph, you can select to hide or show the display of total licenses in the Advanced Filtering area, as shown below.

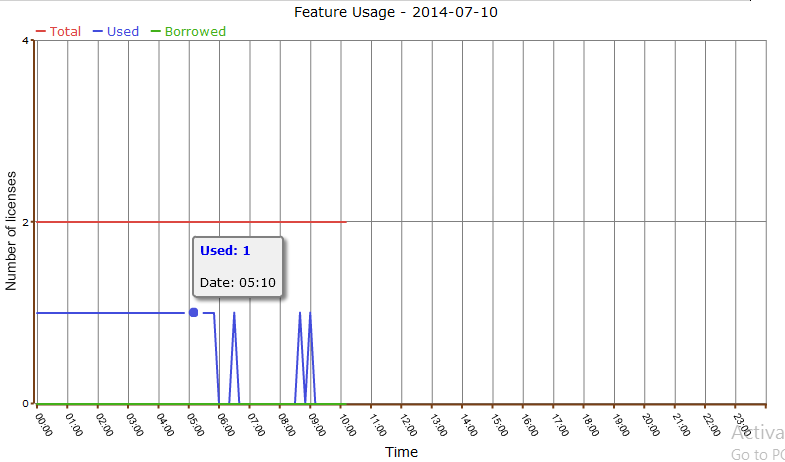
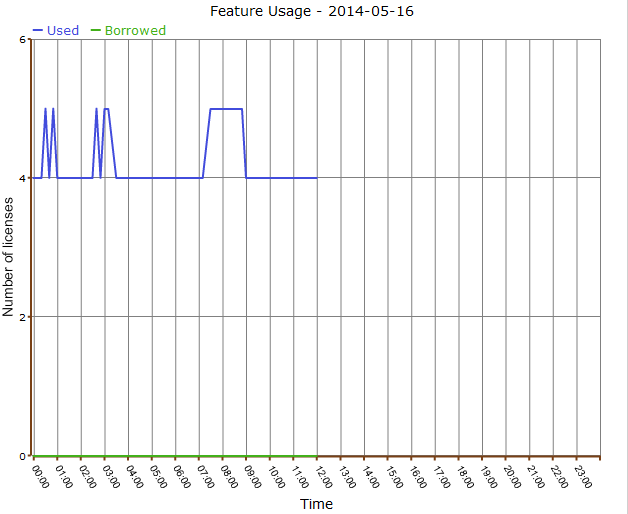
Toggling off the "Show total licenses on the graph" box will remove the "Number of licenses" lines from the graph. This can be useful if the license usage is relatively low, because it can make the graph lines easier to read, as shown in the examples below.
The following graph has total license display toggled on.
Hiding or showing the display of selected usage details on the graph
You can control the display of selected usage details for each graph by clicking the value The following graph has total license display toggled off.
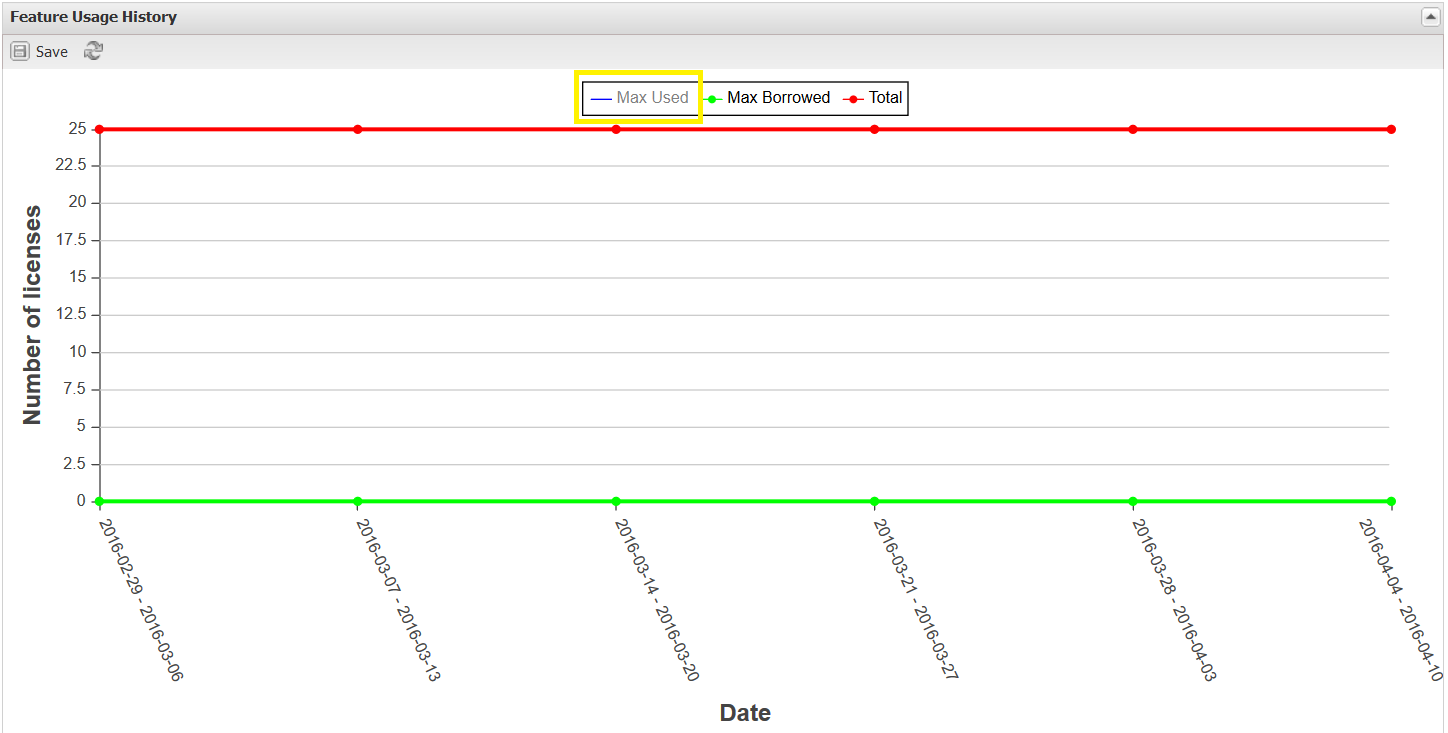
 In the Feature Usage History graph, you can additionally hide or show used and borrowed licenses. The display of these usage details in the graphs is controlled by clicking the status for which you want to view data in the legend at the top of the chart. For example, toggling off the used license display clicking the "Total" option on the graph legend will remove the lines line showing the number of used total licenses.
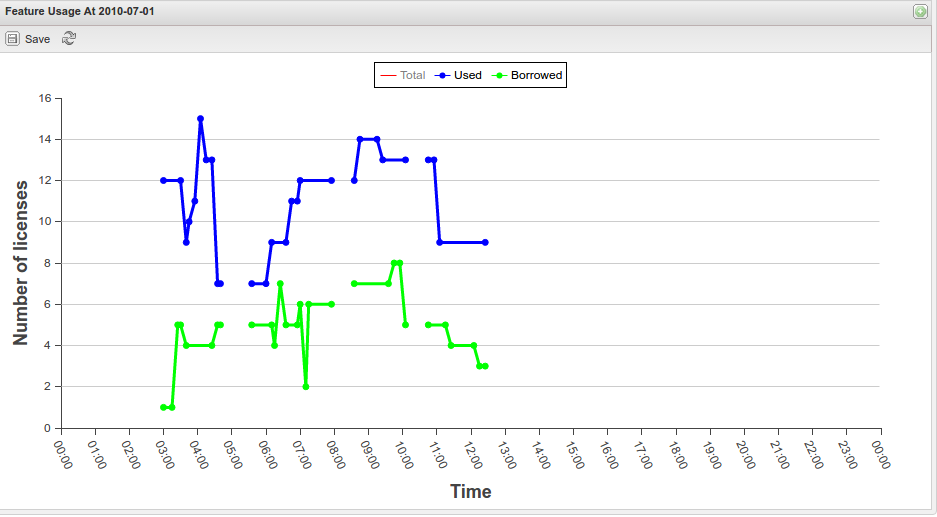
The graph below shows the number of borrowed and total licenses and the display of used licenses is hidden (greyed out).following graph has total license display disabled (greyed out).
Gaps in collecting data
Empty spaces or "gaps" in the chart indicate periods when License Statistics was not running and data was not being gathered. This can happen due to one or more of the following reasons:
- the status of the license server has changed
- an error message about the server status has been recorded in the error log
- License Statistics has been stopped
The following Feature Usage History graph from the Usage History report shows periods when data was not collected.