...
- Modify chart properties, including settings for Title (renaming the chart and changing the appearance of the title text); Plot (renaming and changing the appearance of the axes and the lines in the plot, and setting the orientation of the plot); and Other (rendering options).
- Save the graph (currently limited to .PNG format).
- Print the graph.
- Zoom in/out on both axes or one axis (Domain, the horizontal line; or Range, the vertical line). For example, if you select Zoom Out > Domain Axis, the timeline on the graph will be less detailed and show a greater length of time. Zooming in shows greater detail over a shorter period of time.
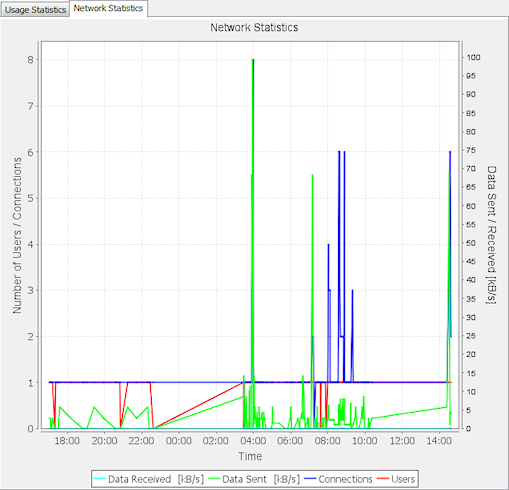
- Zoom automatically to the extent of one or both axes of the graph. For example, the Network Statistics graph shown below has been zoomed automatically to both axes, so it shows all existing data (the data has been gathered for 20 hours and the upper limit of data sent/received is 100 kBkilobytes per second).
In addition to these shortcut menu zoom options, you can also click and drag to zoom to particular details in the graph.