...
To choose the feature for which to view statistics, use the pick lists in the Select License Server and Feature area. You can also select multiple features to see a comparison graph, as described below.
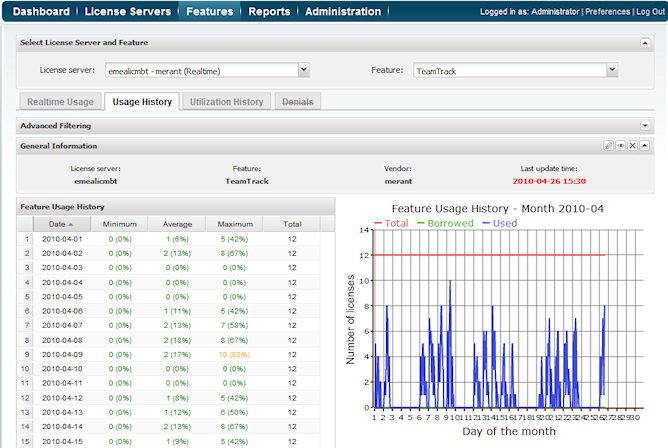
General Information
The General Information area includes identifying information for the feature, including the last update time. You can edit the feature details by clicking the Edit icon on the right end of the General Information title bar.
...
The Feature Usage History grid includes both the number and percentage of minimum, average, and maximum percentage of use for each day in the month and license usage and minimum and maximum borrowed licenses. The grid also includes the total number of licenses for the selected feature. Note that the highest usage is highlighted in yellow, as shown in line 9 of the above illustration.
Feature Usage History graph
...
In addition, you can select the date range for which to view statistics from the Date range calendar.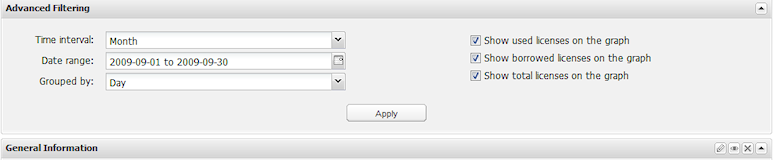
For example, if you choose to group results by quarters in a selected year, your results will look similar to the following:
...