...
To choose the feature for which to view statistics, use the pick lists in the Select License Server and Feature area. You can also select multiple features to see a comparison graph, as described below.
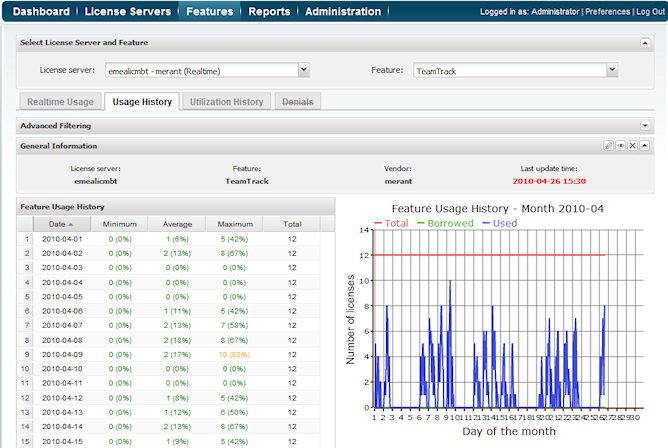
General Information
The General Information area includes identifying information for the feature, including the last update time. You can edit the feature details by clicking the Edit icon on the right end of the General Information title bar.
Feature Usage History grid
The Feature Usage History grid includes the minimum, average, and maximum percentage of use for each day in the month and the total number of licenses for the selected feature. Note that the highest usage is highlighted in yellow, as shown in line 9 of the above illustration.
Feature Usage History graph
The Feature Usage History graph plots the number of licenses used per day, shown in hourly intervals, throughout the selected month. This graph gives you a quick picture of license usage fluctuation during the selected month. See section 6.6.5, Feature usage graphs for additional information about feature use graphs.
Filtering results
Using the pick lists in the Advanced Filtering area, you can choose to show results in the Feature Usage History grid by the following intervals:
...
The Advanced Filtering area also lets you choose whether to show used, borrowed and total licenses on the graph. Toggling off used or borrowed licenses can be particularly helpful when comparing multiple features (described below), to limit the amount of detail shown in the graph. For more information about graphs, see section 6.6.5, Feature usage graphs.
Comparing multiple features
You can compare up to 10 features using the Add Feature button in the Select License Server and Feature area.
...