...
The Dashboard, License Server, and Features pages include collapsible areas that let you control how much information is displayed on the page at one time. These areas have a collapse/expand arrow on the right side of the title bar. You can collapse/expand these areas by clicking on the collapse/expand arrow or simply by clicking anywhere on the title bar.
Showing/hiding graph lines
You can click on the labels of License Statistics graphs to show/hide the data for that label. For example, the illustration below shows graph lines for all the data that is labeled at the top of the chart:
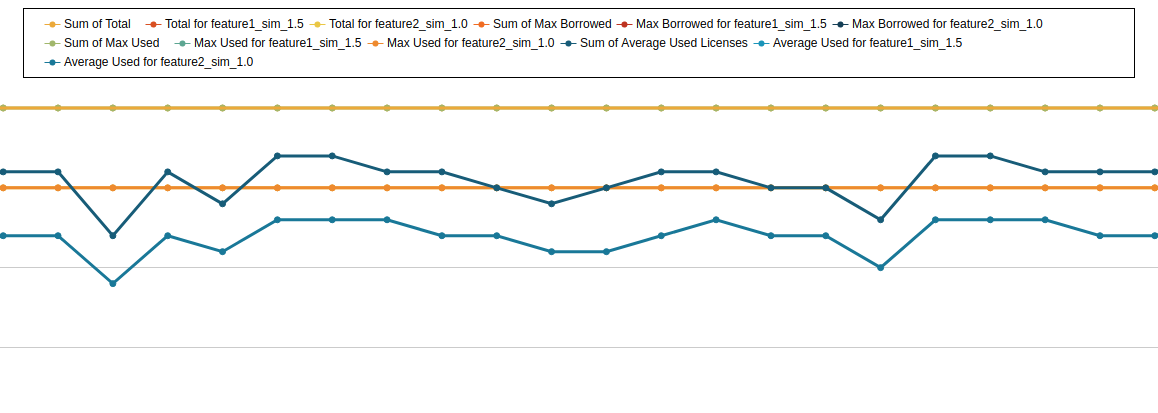
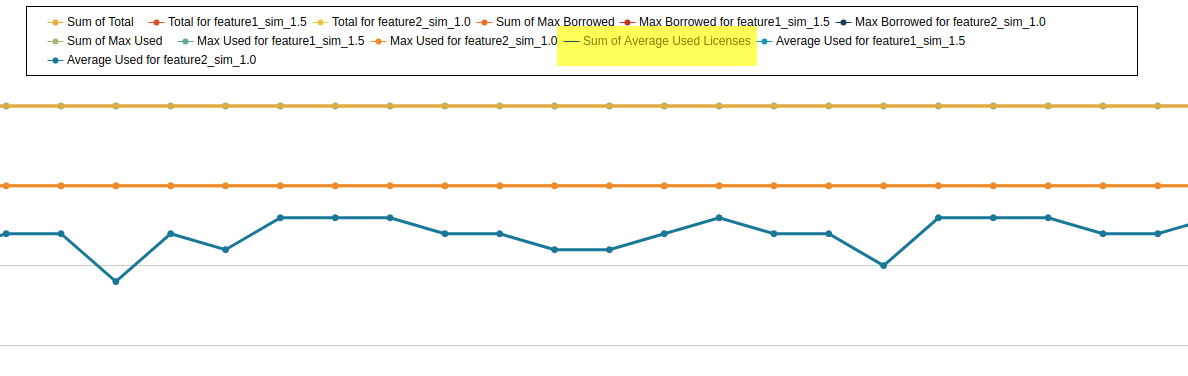
The following example shows the result of clicking on the "Sum of Average Used Licenses" label, which hides its graph line in the chart and grays out the label. To redisplay a hidden graph line, simply click its label again.
Sorting and filtering grid content
...