...
To choose the feature for which to view statistics, use the pick lists in the Select License Server and Feature area. You can also select multiple features to see a comparison graph, as described below.
(pic)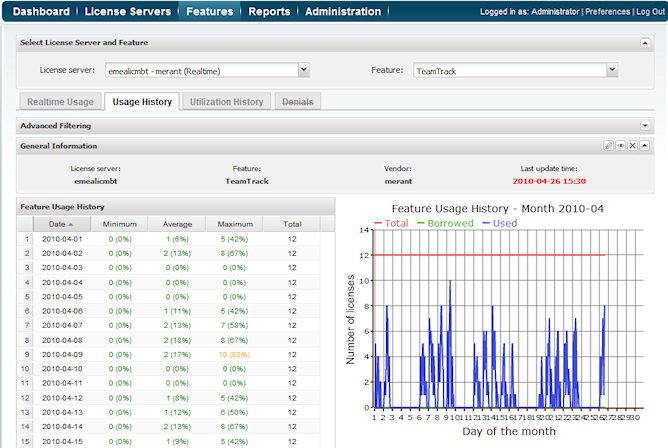
General Information
...
In addition, you can select the date range for which to view statistics from the Date range calendar.
(pic)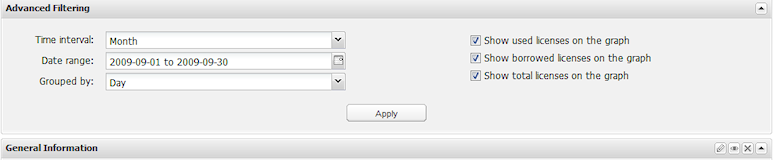
For example, if you choose to group results by quarters in a selected year, your results will look similar to the following:
(pic)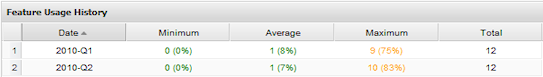
The Advanced Filtering area also lets you choose whether to show used, borrowed and total licenses on the graph. Toggling off used or borrowed licenses can be particularly helpful when comparing multiple features (described below), to limit the amount of detail shown in the graph. For more information about graphs, see section 6.6.5, Feature usage graphs.
...
- Click Add Feature. The License server defaults to the previously selected license server.
- Select a different license server if desired.
- Select the feature to compare to the previously selected feature(s).
- Click Apply. A graph that compares the selected features is shown at the bottom of the page. (Note that the Feature Usage History grid no longer displays when comparing features.)
- Repeat the above steps to add more features to compare.
(pic)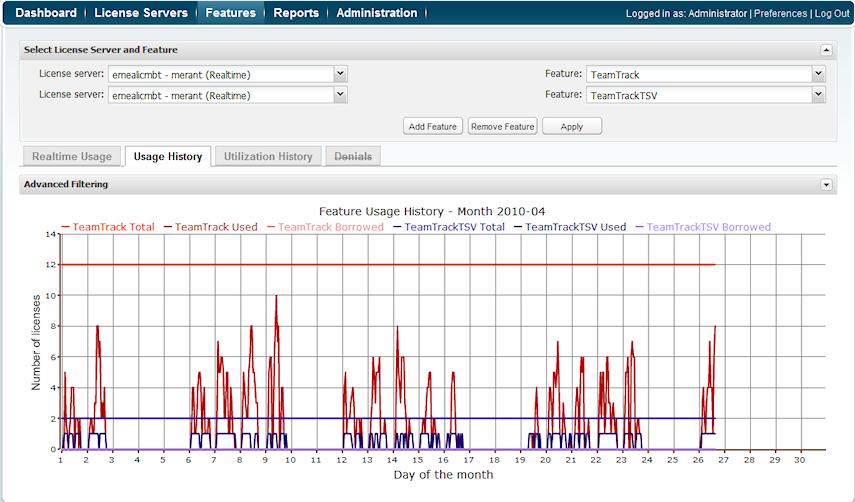
To remove a feature from the list of features to compare:
...