The information on this page refers to License Statistics 6.0 and newer, which introduced a new user interface (UI). If you are using a version previous to v6.0, see documentation for previous versions. |
How effective is your IT asset management? Are costly licenses lying underused? Are users unable to do their work because they cannot access the software they need? Clear answers to these questions can save you thousands in unnecessary license purchases and lost productivity.
...
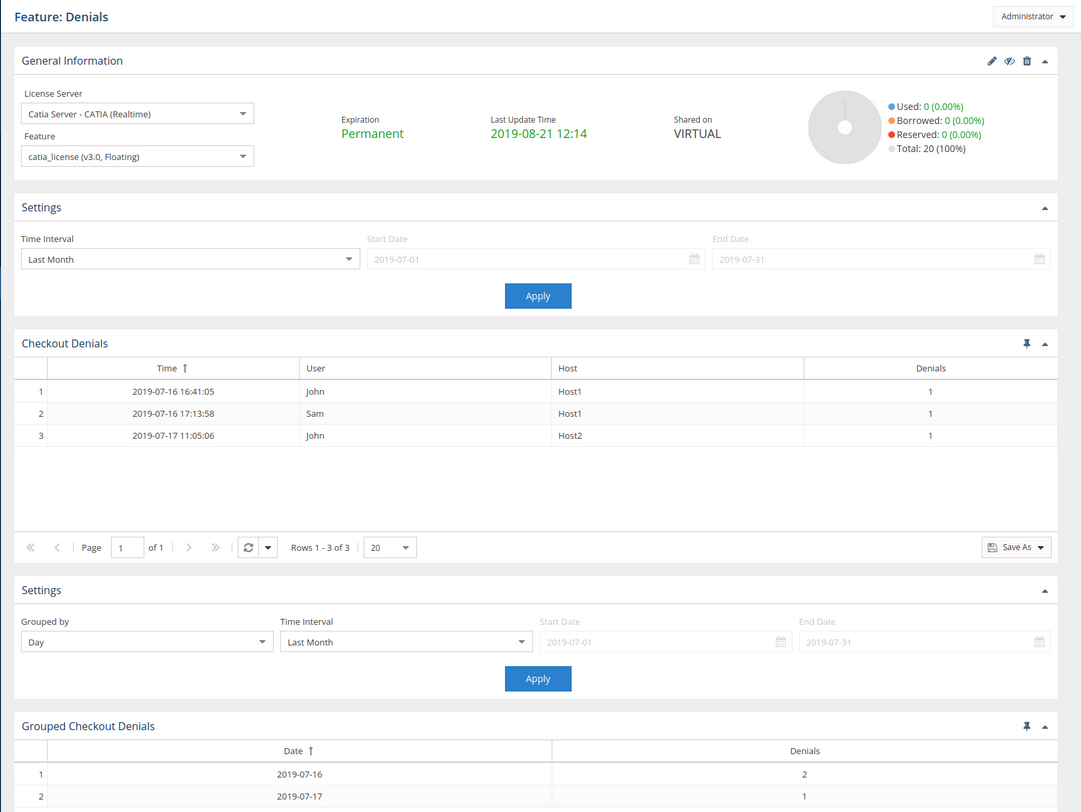
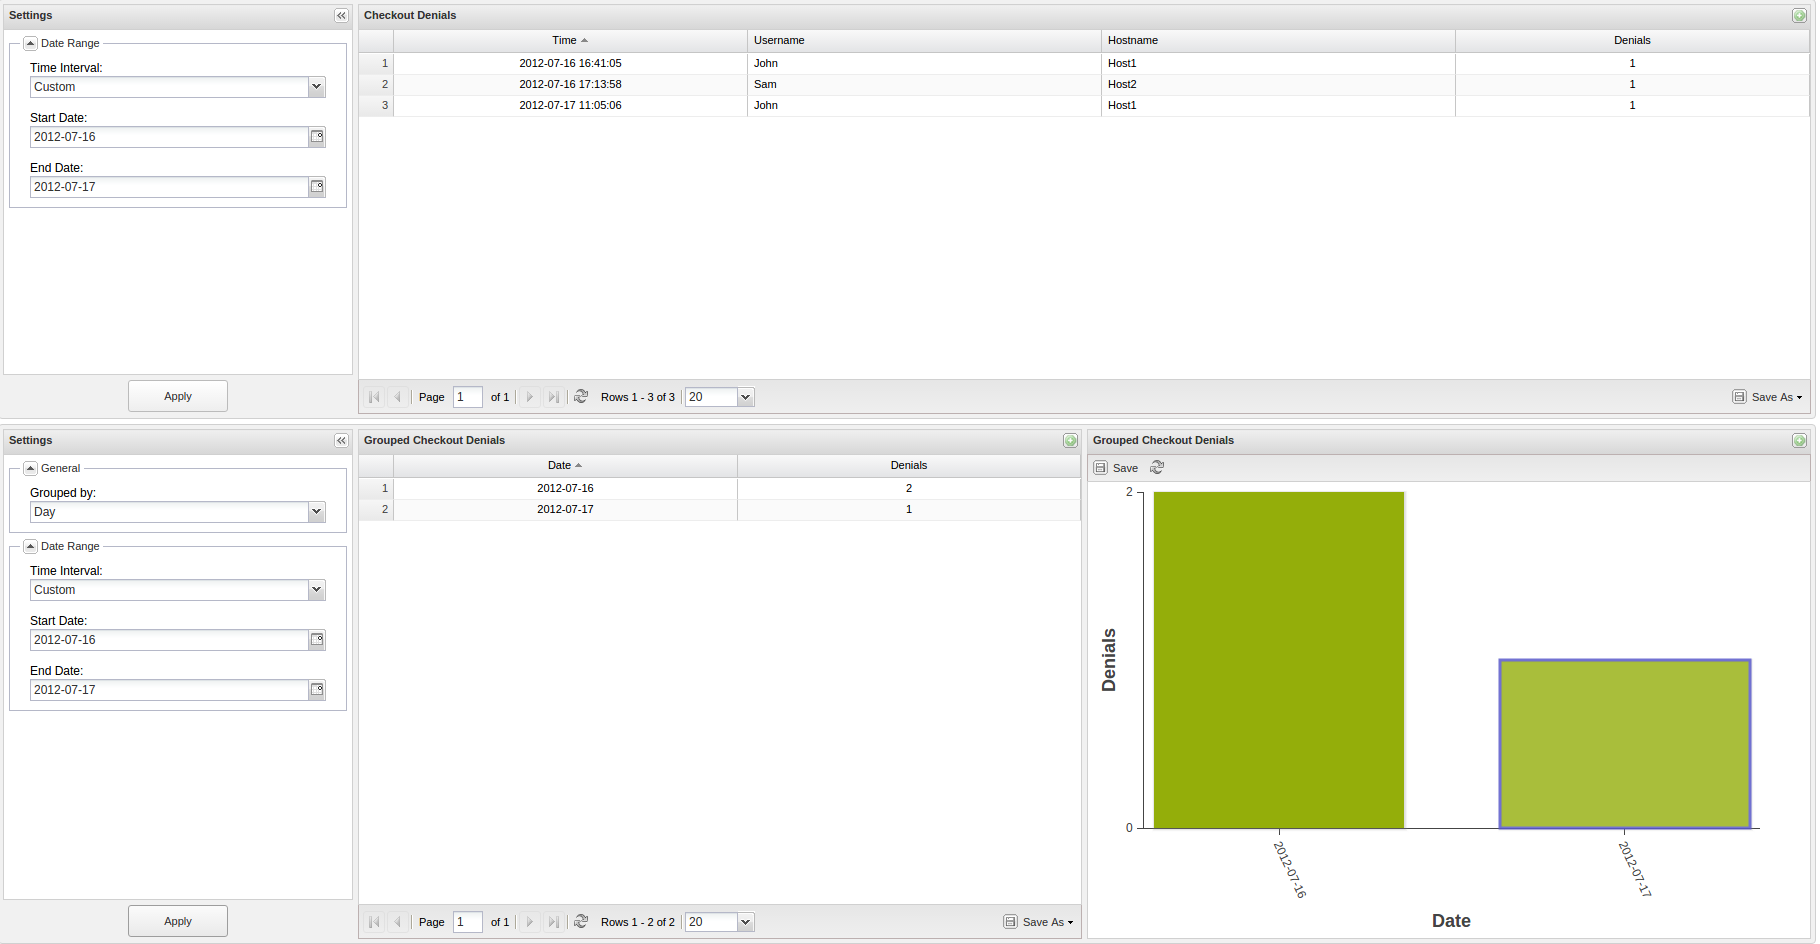
Let's assume we want to see how many denials occurred for two users, John and Sam. The Checkout Denials grid shows the username user and hostname host for each denial and the time the denial took place. You can group denials by a period of time (hour, day, week, month, or quarter) to quickly get a clear picture of periods of time when the denials were most frequent. The following Grouped Checkout Denials chart shows denials grouped by day. According to the chart, denials were lowest on the 17th of the month, and were at their highest on the 16th.
Gaining deeper understanding of your license usage and seeing the extent of license overuse that may prevent key users from accessing the software they need will help you better forecast your future licensing needs and plan your purchasing accordingly.
...