...
The information on this page refers to License Statistics 6.0 4.1 and newer, which introduced a new user interface (UI)applied visibility settings to the Highest License Usage chart. If you are using a version previous to v6.4.01, see documentation for previous versions. |
In addition to daily, weekly, monthly, quarterly, or yearly statistics, License Statistics lets you see the current usage information for each user, giving you detailed information that you and your management may need to make budgeting and other decisions. The information shown by the Current Users report includes the hostname of the machine host on which the feature is checked out, details of the features used, the number of licenses in use, checkout time(s), and which license servers the features are running on.
Example
Let’s assume you want to find out which features are currently being used and by whom. You can get a quick overview of your current license usage by viewing the Current Users pie chart, as illustrated below.
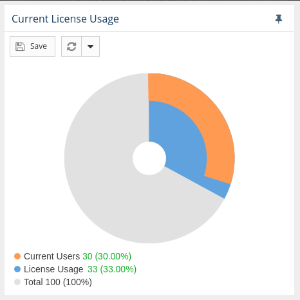
The above example shows that 30 percent of the total number of users are currently using at least one license, license usage is at 33%, and the remaining percentage of licenses are not being used. Knowing the percentage of users who are currently using at least one license, and the percentage of users who are not using any license at all helps you effortlessly monitor and manage your license usage at a high level.
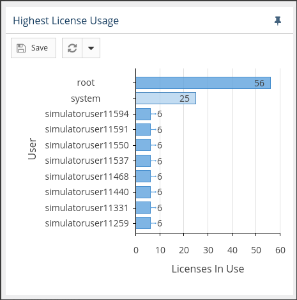
The Current Users report also consists of the Current Users with Highest License Usage bar chart that shows not more than 10 currently active users that are using the highest number of licenses, as shown below.
| Info |
|---|
As of License Statistics v6.4.1 visibility settings are applied to the Highest License Usage chart, so usage of hidden Features and/or License Servers is excluded. |